Perspectives of abiotic resources
A matter of Stocks
The stocks’s stakes
Climate change – CO2 eq « stock »
[6] BP, 2020. BP Statistical Review of World Energy. [online].
[20] EIA, U.S. Energy Information Administration, 2016. Carbon Dioxide Emissions Coefficients. [online].
[21] IPCC. 2018. Mitigation Pathways Compatible with 1.5°C in the Context of Sustainable Development. . P. 82.
Oil emissions of current reserves
Proven reserves :
-> 1733,9 billions barrels [6]
53750,9 billion gallonsAverage on varied oil uses gives ≃ 10 kg CO2 emitted per gallon [20]
-> 537,5 Gt CO2
World CO2 eq budget, current estimations : [21]
1170 Gt CO2 eq to stay <2°C of global warming
420 Gt CO2 eq to stay <1,5°C of global warming
Consomption of all current proven oil reserves is half of our total 2°C world budget and more than our total 1,5°C budget!
Without even considering natural gas, coal, or other emissions (CH4, for example) contributing to radiative forcing...
This considered, without changes, the 2°C threshold should be crossed in about 26 years
[3] BIHOUIX, P., GUILLEBON, B. ,2010. Quel futur pour les métaux?
[10] Data & Statistics,. IEA[online]. Available from : https://www.iea.org/data-and-statistics
And mining is very dependent of highly carbonated, non renewable energy vectors

Adapted from [3] .The values for World averages of Electricity origin were replaced by updated data rom [10]
Production peak
[6] BP, 2020. BP Statistical Review of World Energy. [online].
[15] JANCOVICI, J-M, 2019. Les Energies fossiles. Ecole des Mines [online].
[22] World Energy Outlook 2018. IEA –International Energy Agency.
Hypothesis: we don’t mind CO2 eq emissions
Either we consider it’s not a problem
Or we think innovation or start-ups will solve that
-> Exhaustion of Reserves through Production will still occur!
R/P ratio: most simplified model
Considering current reserves [6]
And 2019 rate of consomption [6] taken as constant for the years to come (quite unrealistic hypothesis of no flow reduction)
-> No oil remaining in ≃ 50 years
[23] CALVO, G. et al.., 2017. Assessing maximum production peak and resource availability of non-fuel mineral resources.
[15] JANCOVICI, J-M, 2019. Les Energies fossiles. Ecole des Mines [online].
[22] World Energy Outlook 2018. IEA – International Energy Agency.
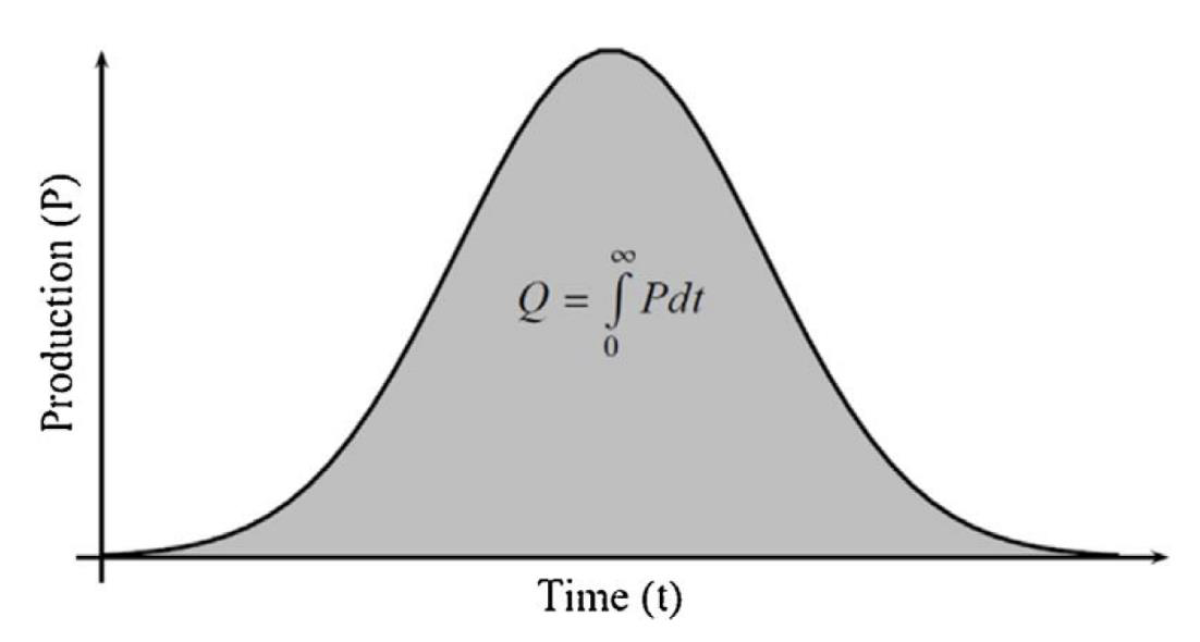
A slightly better estimate: the Hubbert peak model (1956)
We know there is no production at t = 0 and t = t final
The area below the production curve must be equal to the reserve
Regarding conventionnal oil, several countries seems to have peaked already. A review can be found here [15]
It is commonly believed that world production peak of conventionnal oil already happened, in 2008 [22]
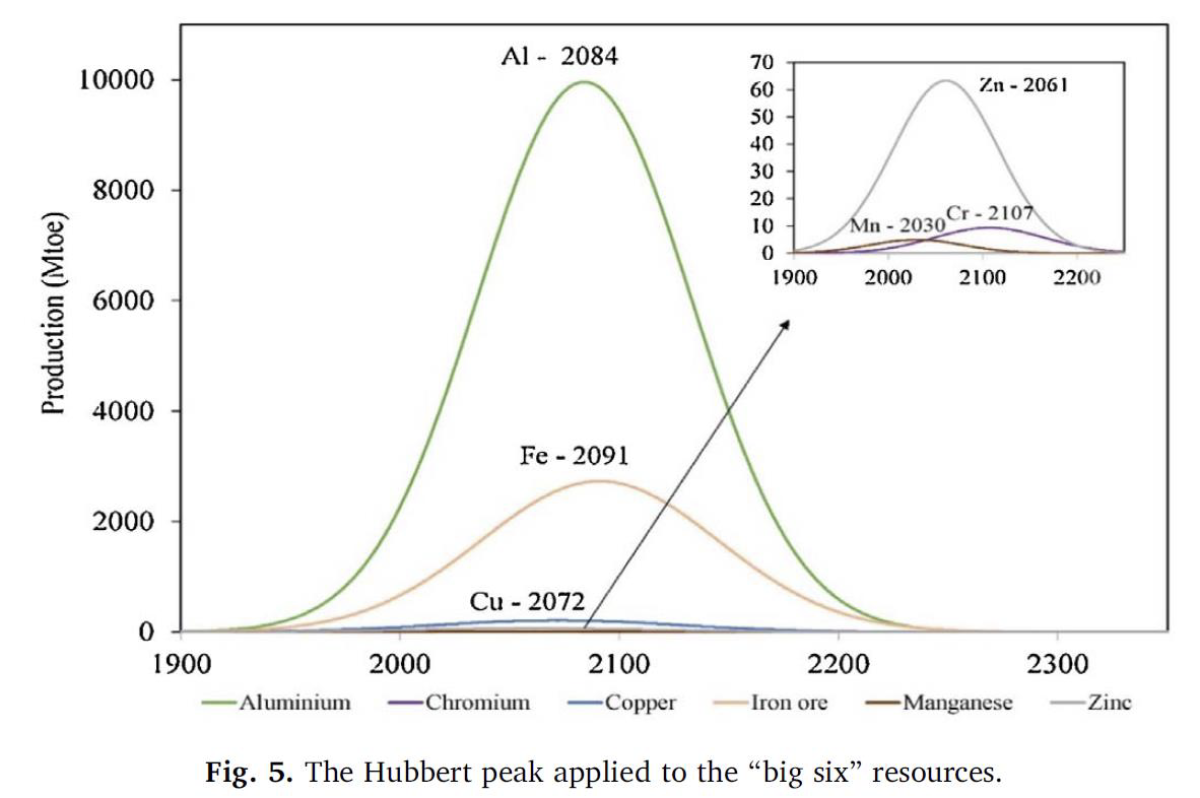
Extracted from [23]
Reliability is influenced by several parameters
Uncertainty regarding reserves information
Particular environmental issues: health, water use, ore grade
Sociopolitical issues: new objects, changes of regulation, or armed conflicts
Interdependencies of byproducts
Substitution & recycling
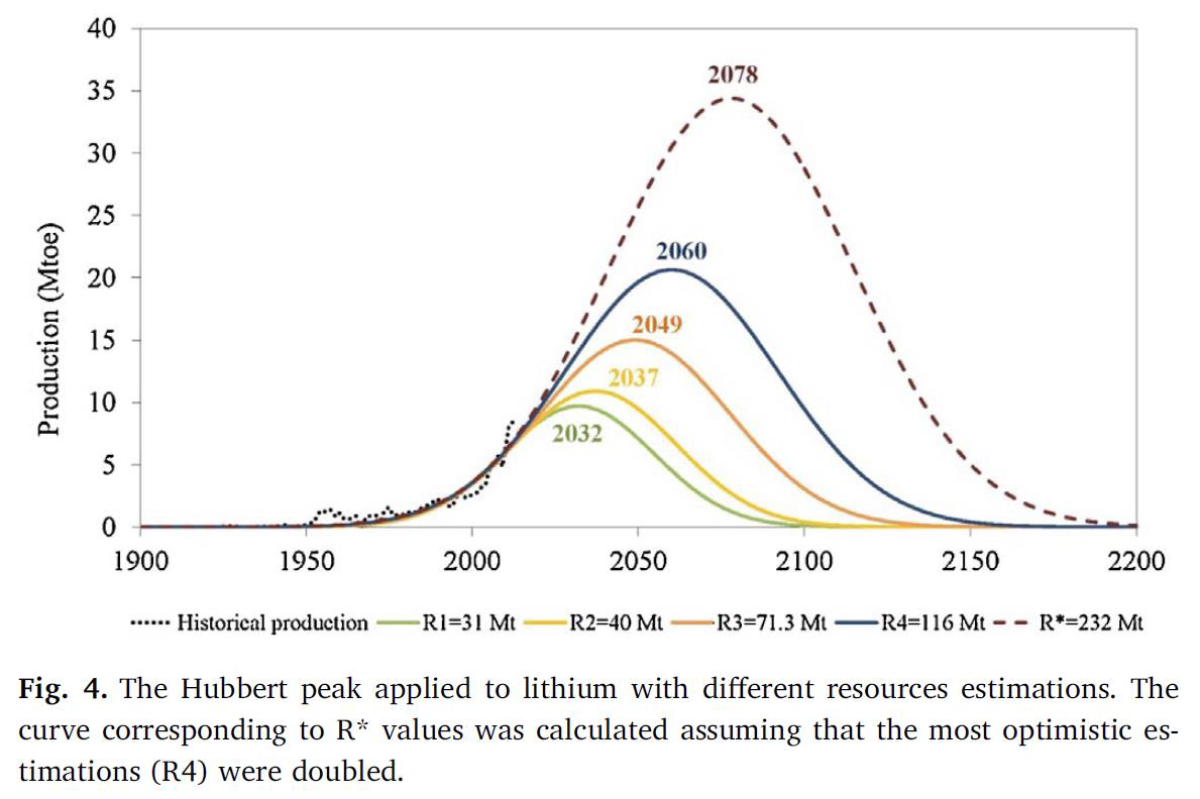
That said, influence of reserves’ variation is limited when rapported to the current trends in production and growth of production
-> Li case study: estimated reserves x 8 only delayed the peak by 46 years
Extracted from [23]
This recent try of systematic assessment is quite interesting to read[23] and accessible!
The time scaling is quite short, even for base metals
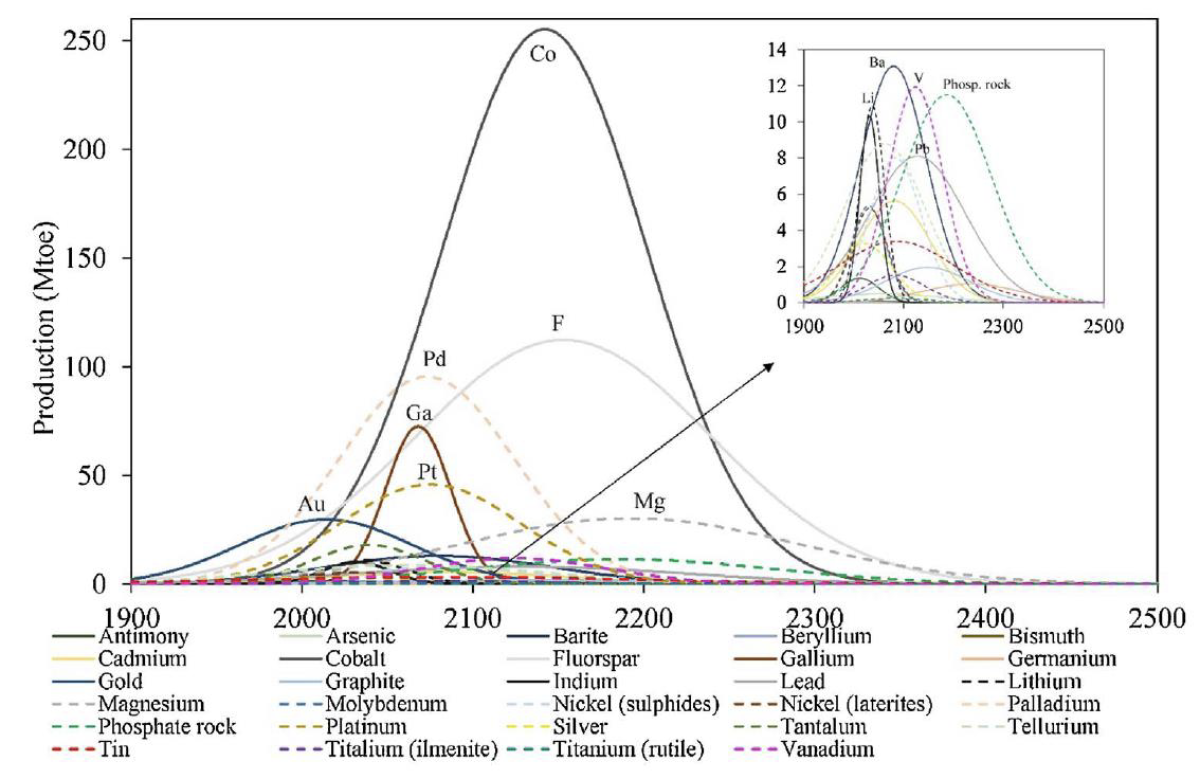
Extracted from [23]
Expected peak in the next 50 years : 12 metals over 47 studied: As, Bi, In, Li, Mn, Mo, Ni, Ag, Ta, Te, Zn
30 metals over 47 have their expected peak in the next 100 years
Gold & Antimony peaked arround 2015 (agreement for Gold with [3])
Extracted from [23]
Taking into account the interdependencies of metals
Bold indicates it is the main production process of said metal
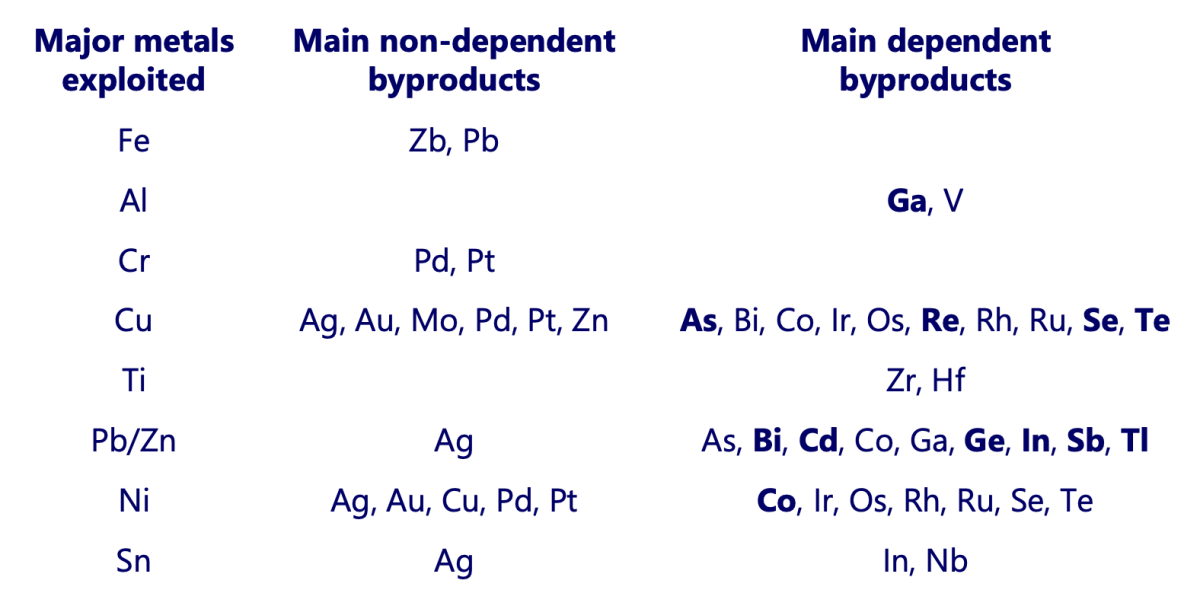
Extracted from [3]
[3] BIHOUIX, P., GUILLEBON, B. 2010. Quel futur pour les métaux?
Nearly a half of metals today exploited are interlinked
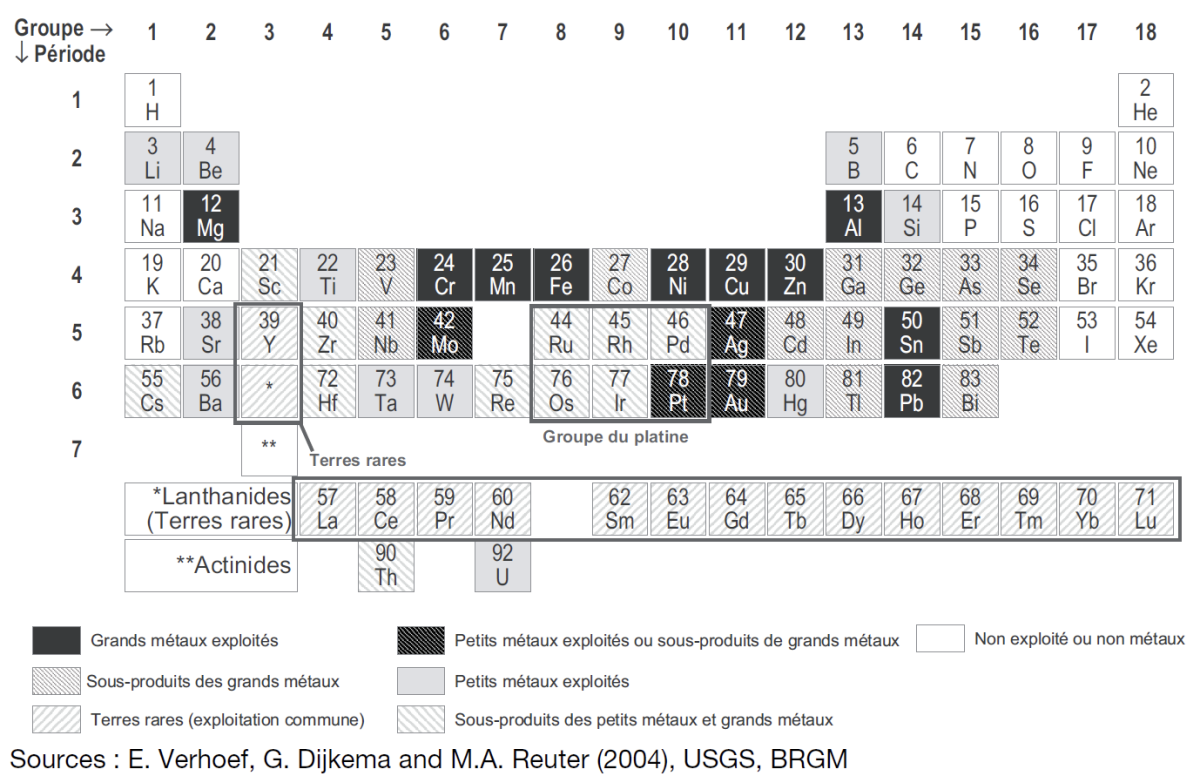
Extracted from [3]
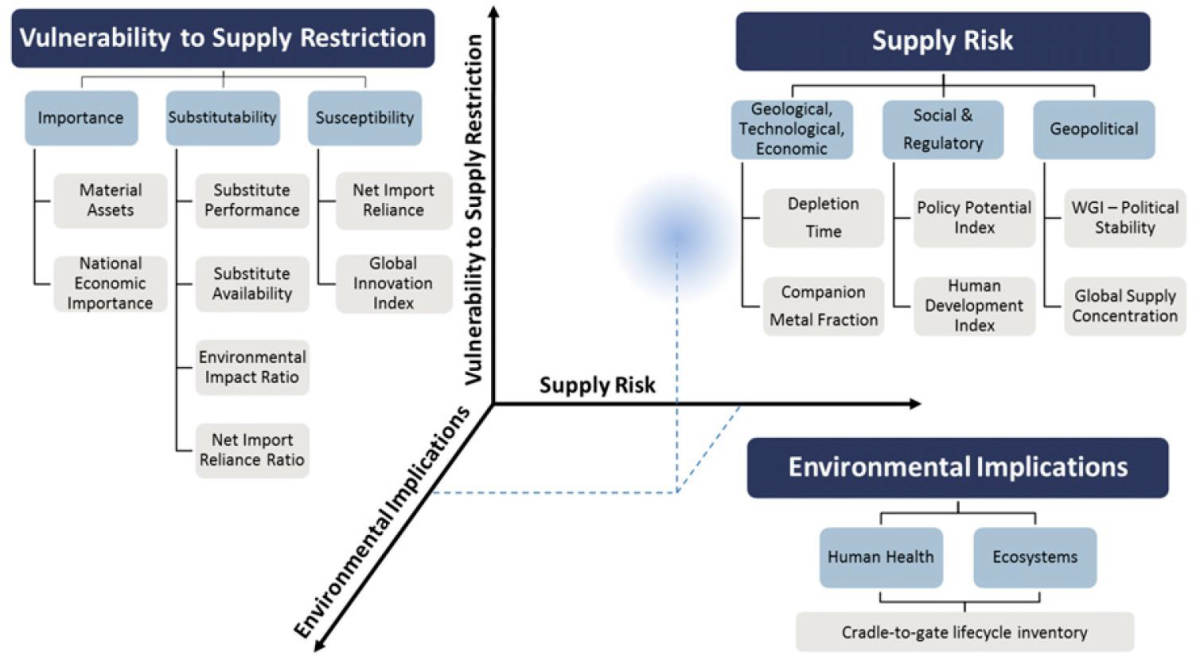
Criticality
[26] GRAEDEL, T. et al., 2015. Criticality of metals and metalloids. DOI 10.1073/pnas.1500415112.
Notion related to the attempt to assess the relative risks concerning the availability of resources
Relatively recent preoccupation
As availability is an already complex notion, its risk analysis is also complex
Geological abondance & concentrations
Potential for substitution
State of the art of mining technology
Amount of regulatory oversight
Geopolitical initiatives
Governmental instability
Economic policy
As reserves are part of the assessment, it is also dynamic
Several methodologies
At different scales of organizations
For different scales of time
With then varied results difficult to compare between each other
Extracted from [26]
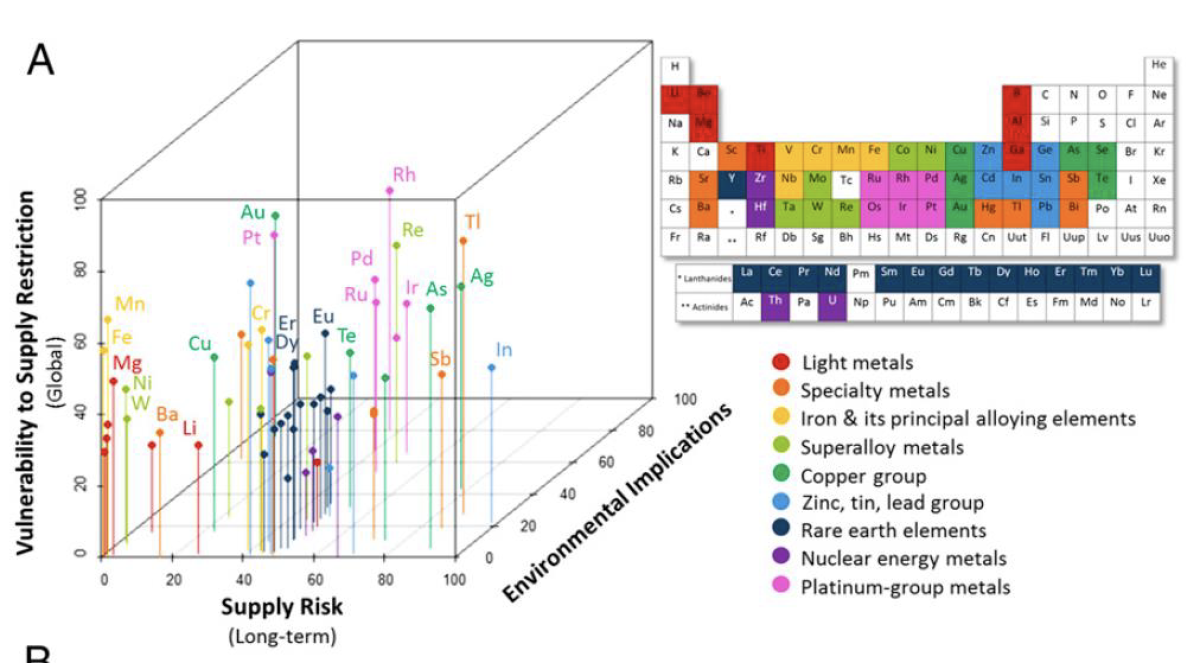
Criticality space: a first step is to get an overall idea
A number of metals are concentrated on the middle: moderately high on at least 2 axis (rare earths, Cr, Te, etc.)
Some are regrouped toward lower left: relatively low criticality (Fe, Mg, Ni, Mn, etc.)
The right side: high supply risk (In, Ag, Tl, As, Sb)
The particular case of Au & Pt
Extracted from [23]
This methodology allow the comparison of varid elements for (here at global level) :
Supply risk
Environmental implications
Vulnerability to supply restriction
Keep in mind it is a relative assessment
Per kg comparison
Results may be underestimated
Database of 2008 (they were in the process ofupdating up to 2012 at publication in 2015)
As data revisions are not frequent & major technology changes occurs slowly, they recommand reassessment on a 5 years basis
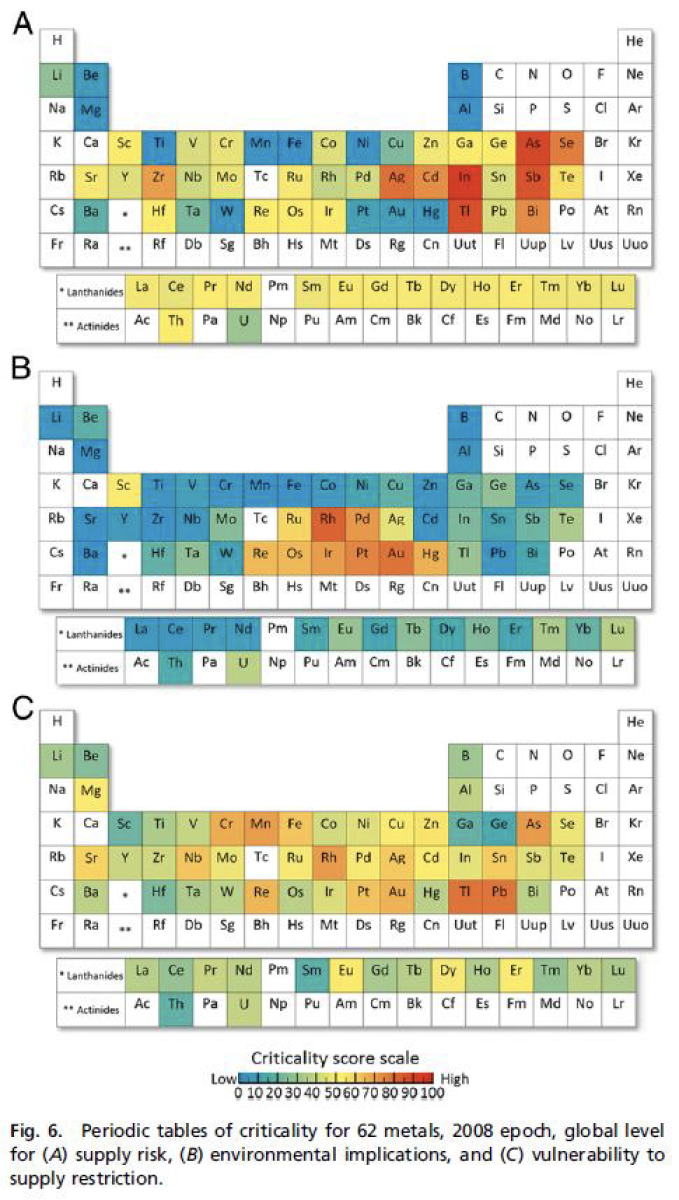
Extracted from [23]
[25] HUISMAN, J., PAVEL, C., et al. 2020. Critical Raw Materials in Technologies and Sectors - Foresight [online].
Preserving stocks
Necessity & Limits of Recycling
[3] BIHOUIX, P., GUILLEBON, B. 2010. Quel futur pour les métaux?
Major difference between oil (energy resources) and metals (mineral ressources) :
Oil, Coal & Natural Gas -> mostly burned -> The flow is not retrievable
Metals -> mostly materially conserved -> The flow is retrievable + there is a stock in circulation!
Each year, stocks of metals :
Increases of the producted quantity
Decreases of the lost quantity
Dispersive uses (metals used as dyes or fertilizers)
No recycling (incineration or landfill disposal)
Current recycling
Precious metals (Au) or with moderately high value (Cu): few losses
Less noble metals (Al, Zn) have more important loss rates
No data for a lot of metals used in specific applications (electronics...)
Metals are one of the most interesting category of materials for recycling
Theoretically recyclable an infinite amount of time without diminishing their properties
Have high yield for stock preservation
40% recycling rate -> 80% recycling rate <-> Reserves x 3
50% recycling rate -> 99,9% recycling rate <-> Reserves x 500
Rich countries show that recycling rate can reach high levels for base metals
France (2010): 85% for Fe ; 80% for Al & Cu ; 70% Pb ; 50% Zn [3]
But it cannot do everything
No industrial process have a 100% efficiency -> same for recycling (remelt Al generate a dispersed loss of 1-2%)
A lot of our uses are not compatible with recycling
The trend of higher complexity
> 30 metals in a computer
> 10 alloys of Steel in a car
Prevent us from retrieving the resources: not easy and sometimes techically impossible to detect or separate metals of an allow
This phenomena exist for a lot of our metarials
Glass: mix of transparent & colored glasses -> no more use in most of construction or cars, only bottles
Plastic: often reused in less demanding uses (technically or aestetically)
-> Important to rethink life-cycles of products, raw materials, and mostly uses
-> Integrate less performant or pretty materials & more recycled materials
-> Organize recovery channels to boost recycling rate
-> But also question the trend of high tech solutions instead of low tech ones
-> That is, question the needs
The trend of direct dispersive uses
Dyes (98% of Ti used as TiO2 for white dyes)
Fertilizers (P, Zn, etc.)
Additives (Cr in Glass)
Pesticides (CuSO4 in some organic farming plants)
And « indirecty » dispersive uses (very difficult to recover)
33% of Sn is used in welding
50% of Zn is used in galvanizing
Some metals like Co or Mb are nearly exclusively used in dispersive uses or alloys
The socioeconomic limits
Economical incentives to constructors are not present or sufficient
Lack of reglementation and means to enforce it
Complexity of products and recovery channels does not help
Substitution
Limit the use in rare or noble metals in favor of abondant metals
Critical lens on « innovation »
Aim to maximize a low tech approach as much as possible at the level of product and technology
-> For inorganic solar pannels, Si should be prefered to GaAs, CIGS, and others, even if the conversion efficiency is less important
For critical cases, possibilities needs to be carefully explored :
Cr nearly indispensible for anti-corrosion
-> Ti can replace Cr in certain cases but its energy footprint is 4-5 times higher
Cu nearly indispensible for electrical applications
-> Al can replace Cu in certain cases but its energy footprint is 2-3 times higher
Substituate oil by electrification? [27]
Li-ion batteries represented 37% of Li consumption in 2016 (and 40% of Co)
Batteries for electric vehicules were only 10% of Li-ion consumption in 2018
Most elements at disposal indicates that strong choices of resources’s uses will have to be made in the years to come :
[27] Responsible minerals sourcing for renewable energy, 2019. University of Technology Sydney [online].
[28] ABDALLA, A. et al., 2018. Hydrogen production, storage, transportation and key challenges with applications: A review. DOI 10.1016/j.enconman.2018.03.088
[29] SCHMIDT, O., et al., 2017. Future cost and performance of water electrolysis: An expert elicitation study. DOI 10.1016/j.ijhydene.2017.10.045.
Substituate oil by « hydrogen »?
Currently > 90% of H2 is produced by steam reforming (10 kg CO2 per kg of H2 produced) [28]
Water electrolysis / fuel cells have problems of their own [29]
Alkaline electrolysis is not adapted for electric cars
New technologies currently depends either on Pt and are not industrially mature (PEM) or rare earths and are at the state of demonstrators (SO)
In need of a big & new infrastructure for supply of cars
-> We are back to the vicious circle of energy & material footprint
Challenging needs
[30] BIHOUIX, Philippe, 2014. L’Age des low techs : vers une civilisation techniquement soutenable. Seuil.
The often most efficient stategy to preserve abiotic resources stock
House thermally isolated + put on a sweater >>> room heating technical solution
Most transport on bicycle (short distance) + train (long distance) with minimal use of a car (occasional rental) >>> electric cars replacing current diesel and petrol cars
Simple dismountable and repairable electronics >>> computer assembly with glue with digital prints technology
It is the first of the 7 principles of low-techs [30]
Challenging needs
Design and produce truly sustainable
Orienting knowledge to resources’ savings
Striking a technical balance between performance & conviviality
Relocalize without losing the right scale effects
De-machinizing services
Knowing to remain modest
Indeed this kind of transition imply numerous socioeconomical consequences
As any kind of transition, it is also a matter of flows and their evolution
Medias
A matter of Flow
The flows’s stakes
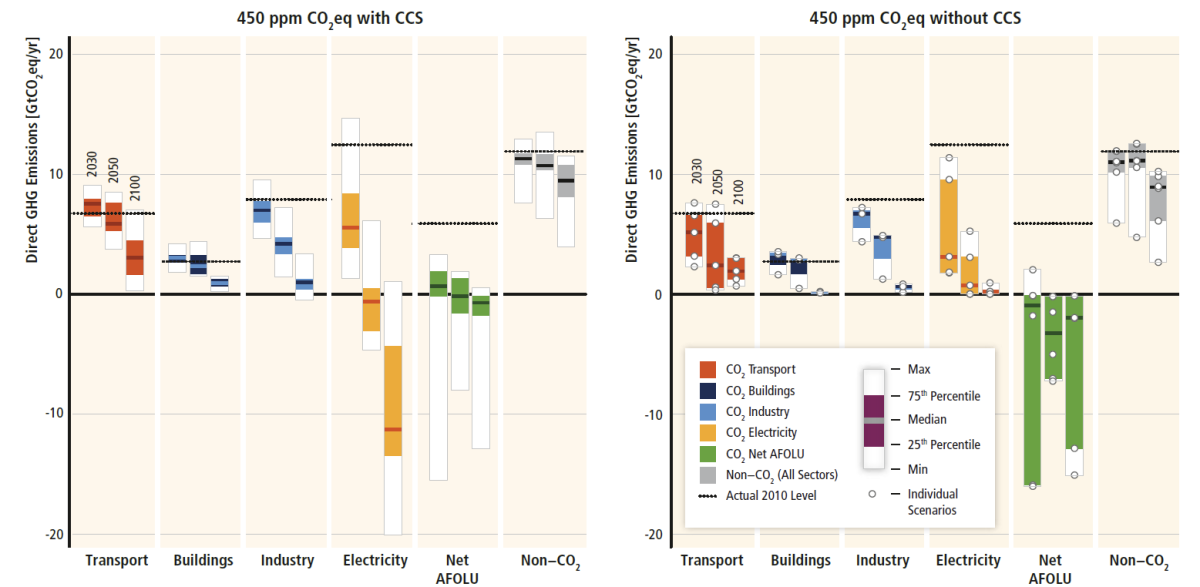
Climate change
[31] IPCC. 2014: mitigation of climate change: Working Group III contribution to the 5th Assessment Report of the IPCC.
Trajectories mitigating climate change all require a global limitation of material & energy flows
Even with the hypothesis of a high developpment of the use of carbon capture and storage (CCS) technologies
[32] HCC, 2020. Maîtriser l’empreinte carbone de la France. Haut Conseil pour le Climat [online].
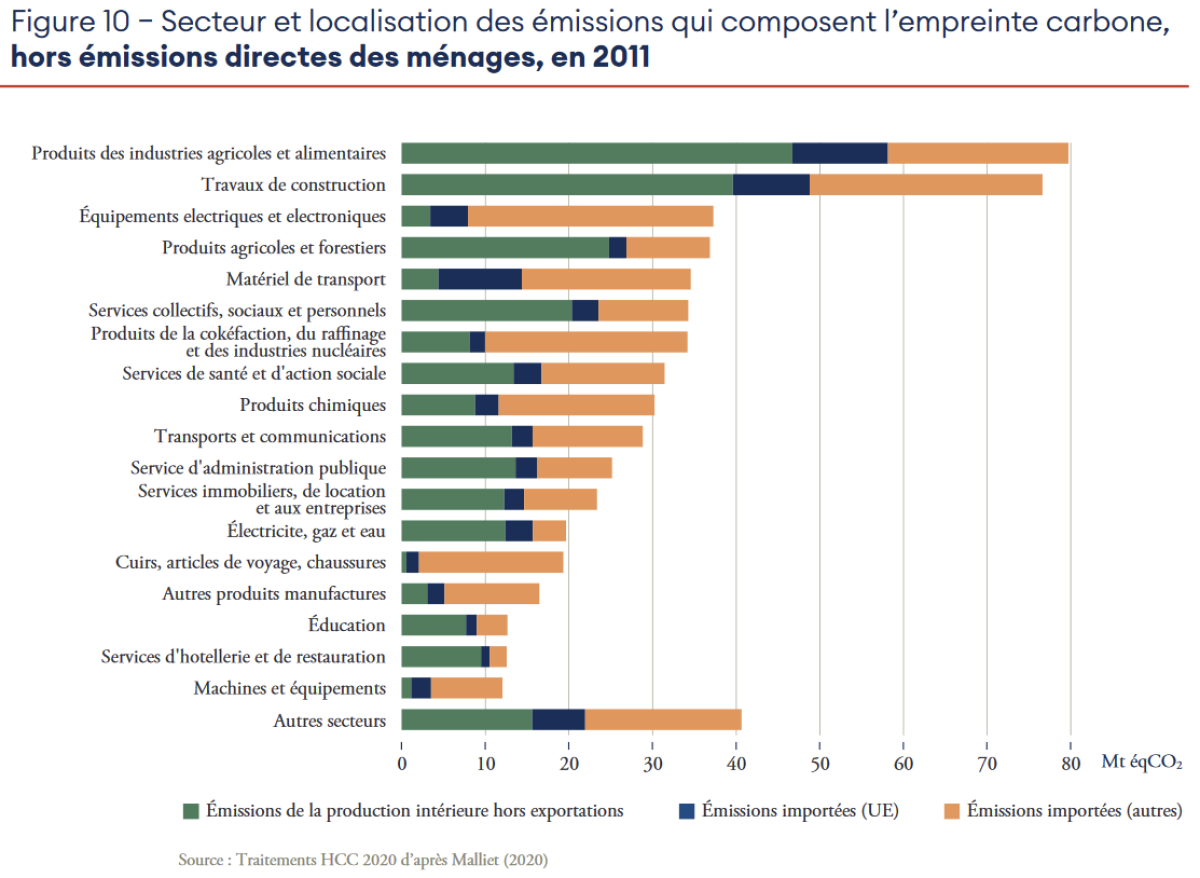
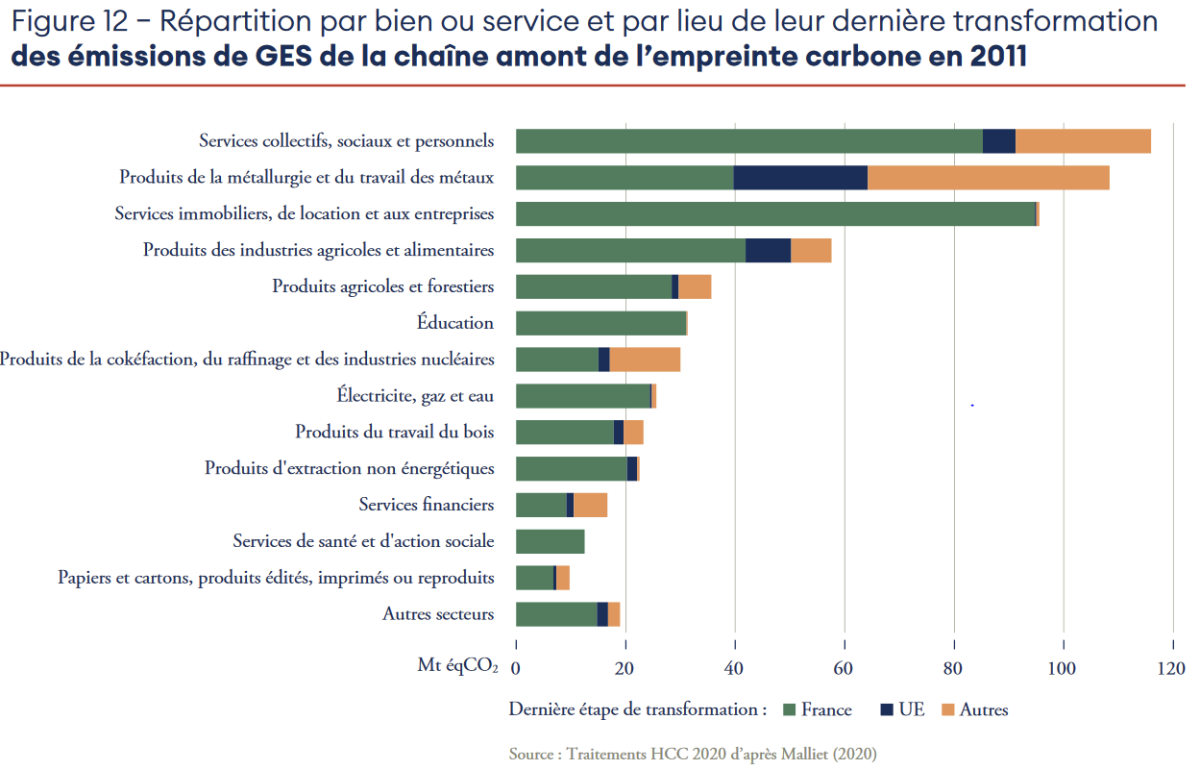
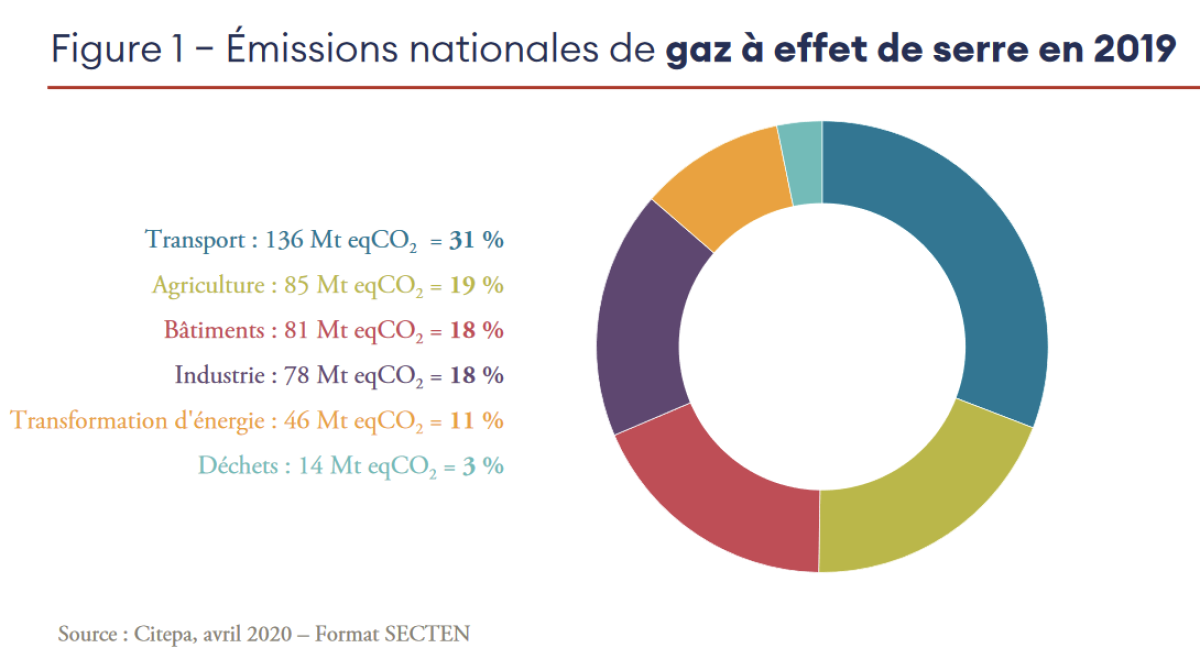
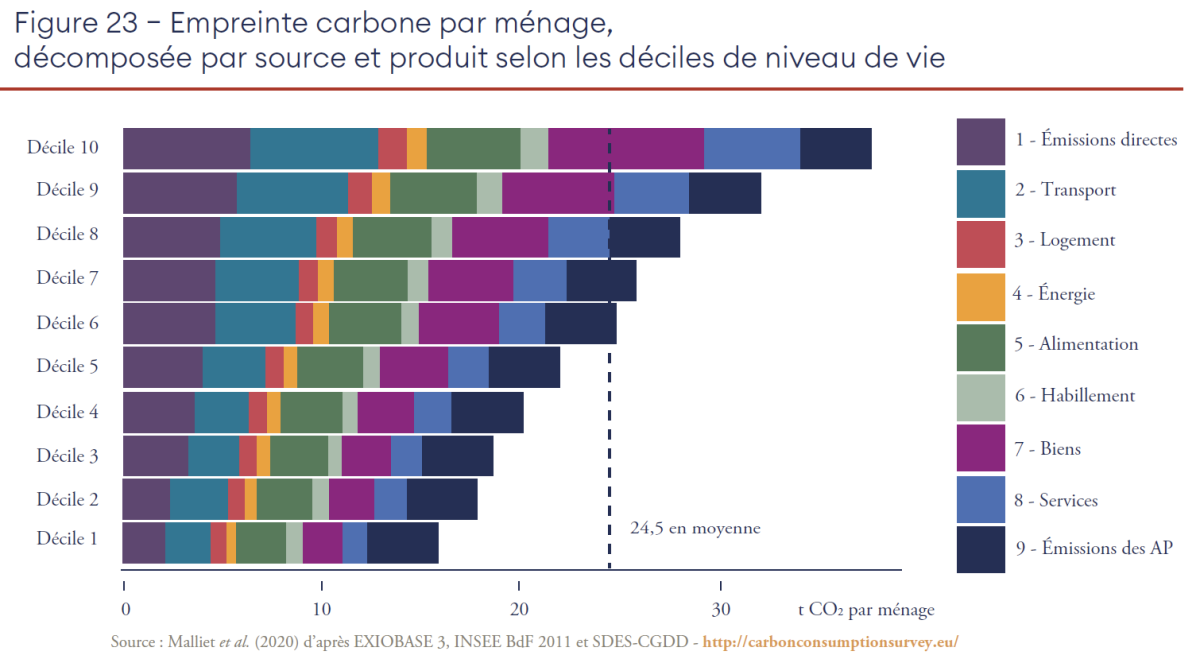
The French carbon footprint
A large part of our carbon footprint comes from importations
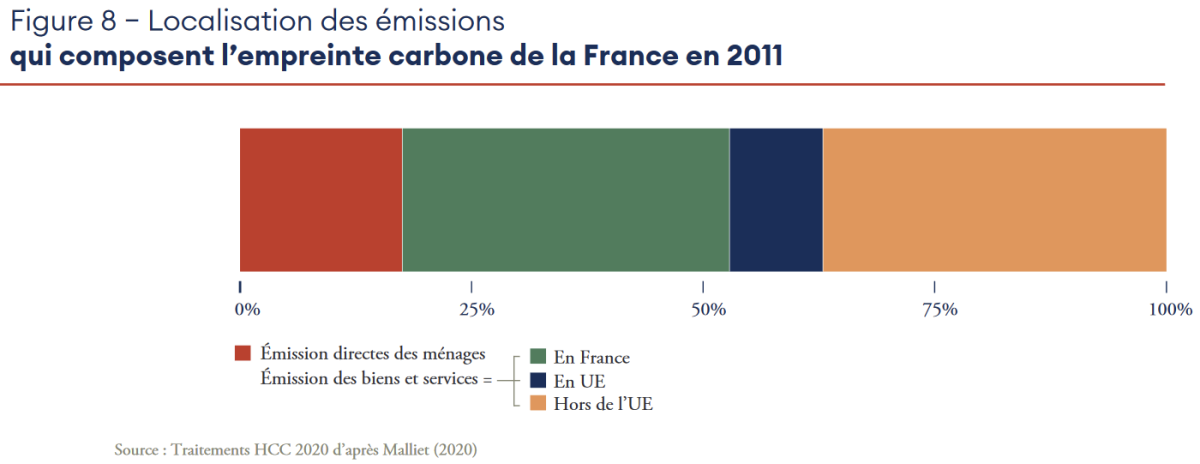
The French situation
Mineral resources: metals & cement
Energy resources & chemical products: oil
Abiotic resources are a large part of it, metals in particular!
In terms of weight of abiotic resources in domestic emissions: oil is dominant through transport (direct emissions), followed by metals & cement (indirect and distributed emissions)
High mitigation potential in transport <-> Combination of varied measures [31]
Low-carbon fuels -> higher flows of metals & lower flow of oil
Lowering vehicules energy intensities -> lower flows of oil & metals
Encouraging modal shift to lower-carbon passenger & freight systems
-> lower flows of oil + short-to-medium term higher flows of metals for infrastructure investments
Avoid journeys where possible -> lower flows of oils
This kind of configuration apply generally
Specific augmentations in flows of metal are required to lower oil flows
Competition between uses requiring metals -> priorities will need to be established
Economics interdependancies
[15] JANCOVICI, Jean-Marc, 2019. Les Energies fossiles. Ecole des Mines [online].
[34] HABERL, H., et al, 2020. A systematic review of the evidence on decoupling of GDP, resource use and GHG emissions, part II : synthesizing the insights. DOI 10.1088/1748-9326/ab842a.
[33] HCC, 2020. Rapport annuel - Redresser le cap, relancer la transition. Haut Conseil pour le Climat [online]. 2020.
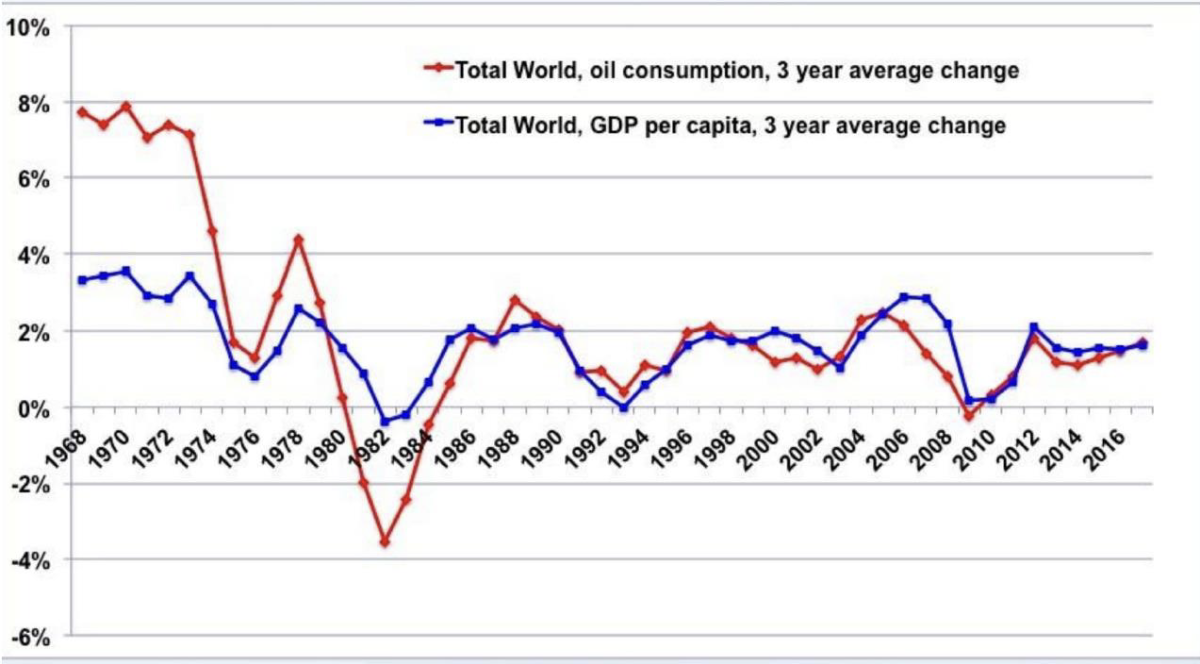
At world scale, there is a historical link between primary energy & material consumption, and economic production (as measured by GDP) [15] & [34]
There is no consensus on the exact nature of the relationship nowadays [33]
But we know that energy & material availability enables GDP growth
And GDP growth, by anticipation of economic growth causes energy & material use
A lot of ambitious climate target rely on the concept of « decoupling » [34]
Promotion of economic growth while reducing material & energy footprint (EMF)
When theorized as absolute -> EMF reduction & GDP growth
When theorized as relative -> EMF slow growth & GDP high growth
Recent systematic review clarifies that :
Relative decoupling is frequent for material use, GHG emissions, but not exergy
Relative decoupling of GDP and primary energy use can be caused by energy efficiency (higher ratio of exergy / primary energy use)
Absolute decoupling situations are very rare and are related to small short-term reductions of emissions
No evidence that absolute decoupling can be generalized
Degrowth/Sufficiency currently seems indispensible to meet climate target and sustainable use of abiotic resources:
Require a contraction of current economics functionning
And even fundamental changes in its functionning too
A byproduct of this scientific inquiries is that GDP is more & more considered as an irrelevant indicator for these problematics
Volatility of prices
[35] ECORYS, 2012. Mapping resource prices: the past & the future [online]. Final report to European Comission.
Base metals’ prices are historically quite constant relatively to each others but individual resource’s price is highly volatile [35]
[6] BP, 2020. BP Statistical Review of World Energy. [online].
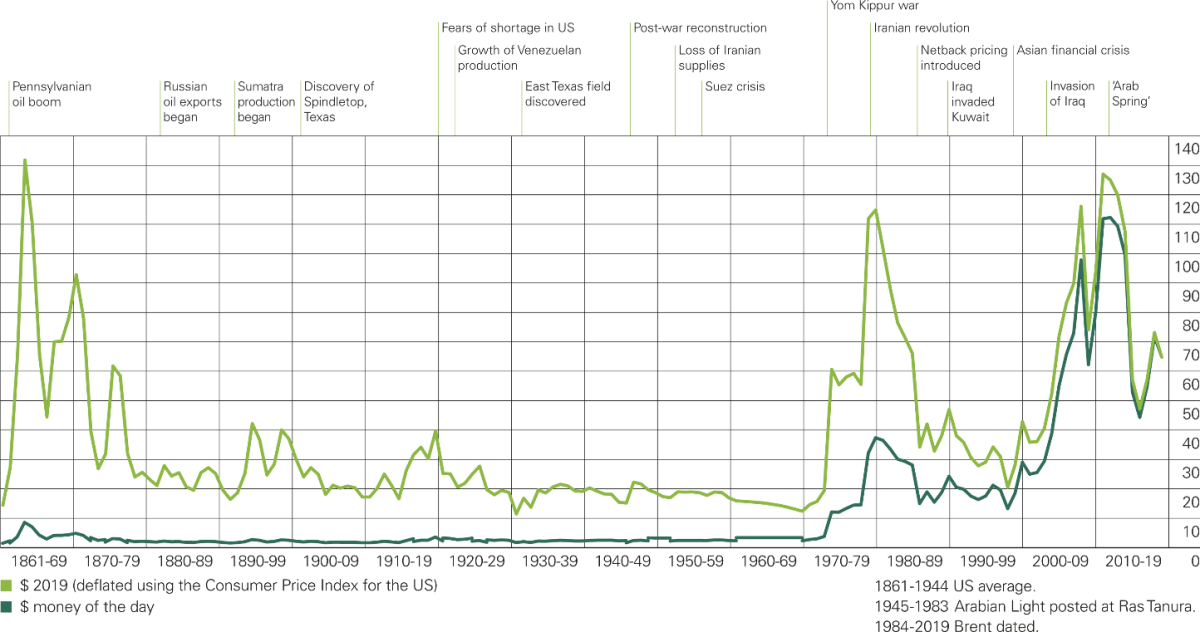
Oil’s price is highly volatile too[6]
Resources’s prices underlying determinations
Percieved availability through control of producers
Degree of substitutability
Resources’s prices mecanisms of formations
Over-the-counter (OTC) markets: traditionnal mecanism
Annual or multi-year supply contracts: mainly, Fe and Fe allows
Pricing on forward markets
Special case of precious metals: considered as quasi-money or OTC.
Historically, numerous resources exchanges were operated by intermediates
Contemporary period: developpment of financialization
Alignment of Raw materials on securities -> far less intermediaries
Developpment of financial product derivatives + capitalistic concentrations of producers
-> overvalued prices and speculations
[36] MITTEAU, Gilles, 2018. Economie et finance du pétrole - Heu?reka. [online].
Financial markets’s specific effects
Efficiency of market -> Trends of prices themselves tend to diseapear
Short-term interest of traders -> Short-term volatility
Complexity of the product and implications of prices variations on the economy
-> Long-term volatility + impossibility to know for sure the causes of prices variations
-> There is no « natural price-signalling » mecanism that makes a non- renewable resource progressively more expensive overtime
-> The « natural » functionning of Financial markets seems to impply that the reduction of energy & material flows lead to higher volatility, or maybe higher « volatility of volatility »
For detailed reasonning, strong recommendation of Youtuber Heu?reka on Economy & Finance of oil
Contracting flows
Limits of efficiency
Like recycling, energy efficiency is necessary
Allow to reduce flows for a given performance
25% energy yield -> 30% energy yield -> 1/6 of oil flows spared per year
25% energy yield -> 50% energy yield -> 1/2 of oil flows spared per year
Same goes for « material efficiency » (diminshing the quantity of material needed to achieve a given functionnality)
But it is not sufficient, and could even be harmful on the global scale
Energy efficiency, when only measure applied, have mainly cost reduction effects
Cost reduction could then lead to democratize preexisting uses or create new ones
This then would lead to an overall increase in energy consumption
[37] SORRELL, Steve, 2007. The Rebound Effect: an assessment of the evidence for economy-wide energy savings from improved energy efficiency. [online]. UKERC
This would be called a « rebound effect » [37]
The « economy-wide » rebound effect is of combination of direct and indirect rebound effects that can interact with each other
Some basic examples of direct rebound effect :
If fuel-efficient vehicules make travel cheaper -> Consumers may choose to drive further / more often -> Offsets the energy savings
If a factory uses energy more efficiently -> Becomes more profitable -> May generate further investments -> More production
Some basic examples of indirect rebound effect :
Drivers of fuel-efficient cars may spend the money saved bying petrol on other energy intensive goods or services (ex: overseas flight)
[38] JEVONS, William Stanley, 1865. The Coal Question. . 1865. P. 213.
Rebound effect concept coms back to the XIXth century
Firstly known as « Jevons paradox » from W. J. Jevons [38]
Steam-engines’ efficiency had been increased by 10-fold at least in a century
Consumption of coal had greatly increased anyway (x 6 in 50 years)
The same considerations could be made about today :
Energy efficiency of cars’ engines have never been better
Our oil cosumption dedicated to it have never been higher
-> Could be explained by:
The growth of car use driven by low cost of oil
And spared cost of cars invested in high-tech supplementary functions which increase car’s weight and maintain oil consumption
The increase in heavy vehicules like SUVs
[39] STERN, David I., 2017. How accurate are energy intensity projections?. DOI 10.1007/s10584-017-2003-3.
Quantified contemporary estimations are complicated :
There is indeed a correlation between various measures of energy efficiency and continuing growth of overall energy consumption
But the causal links between these trends are not clear
Difficulty to assess other things than direct rebound effects
That being said, evidence suggest that : [37]
It has the potential to widely vary between technologies, sectors, income groups
In OECD countries, automotive transport, household heating & cooling can relatively robustly be considered subjects to a direct rebound effect of 10-30% (microscale)
Current energy or material efficiency policies are not up to the task (macroscale)
Predictions of energy footprint decline itself are generally too optimistic [39]
Physics inevitability
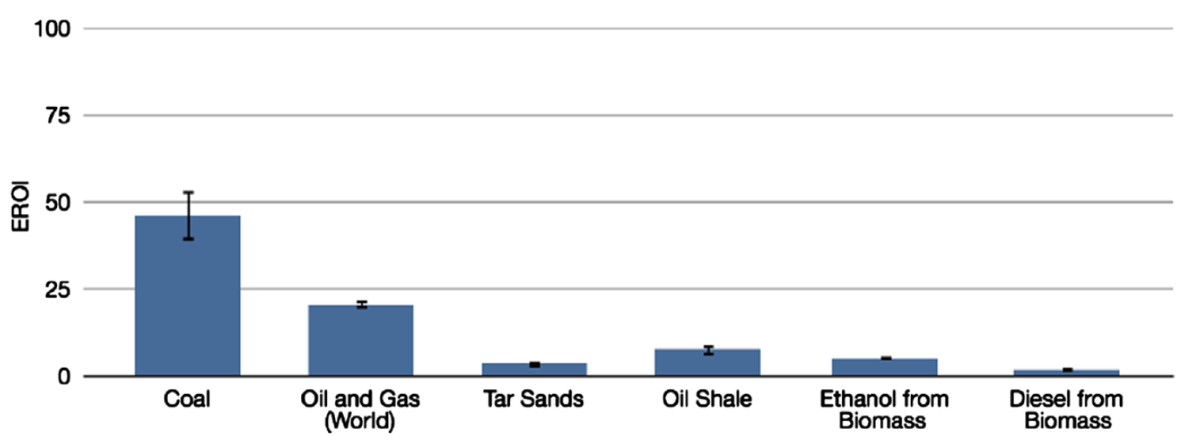
[40] HALL, Charles A. S., et al., 2014. EROI of different fuels and the implications for society. DOI 10.1016/j.enpol.2013.05.049.
Material & Energy flows will decline anyway due to the physics underlying the production peak
We’ve seen that the decline in ores’s grade do lead to an exponential demand in energy for base metals extraction, and that a mineralogical barrier can happen for rarer metals
But oil itself needs energy to be extracted!
Last notion of this course : EROI – Energy return on investment
Ratio of energy delivered by a specific energy vector and the energy invested in the capture & delivery of this energy
Measures the relative quality of energy vectors
Varied possible choices of boundaries in systemic assessments, so as much EROI calculations: standard ; point of use ; extended ; societal
Estimates re complicated due to oil compagnies low level of transparency
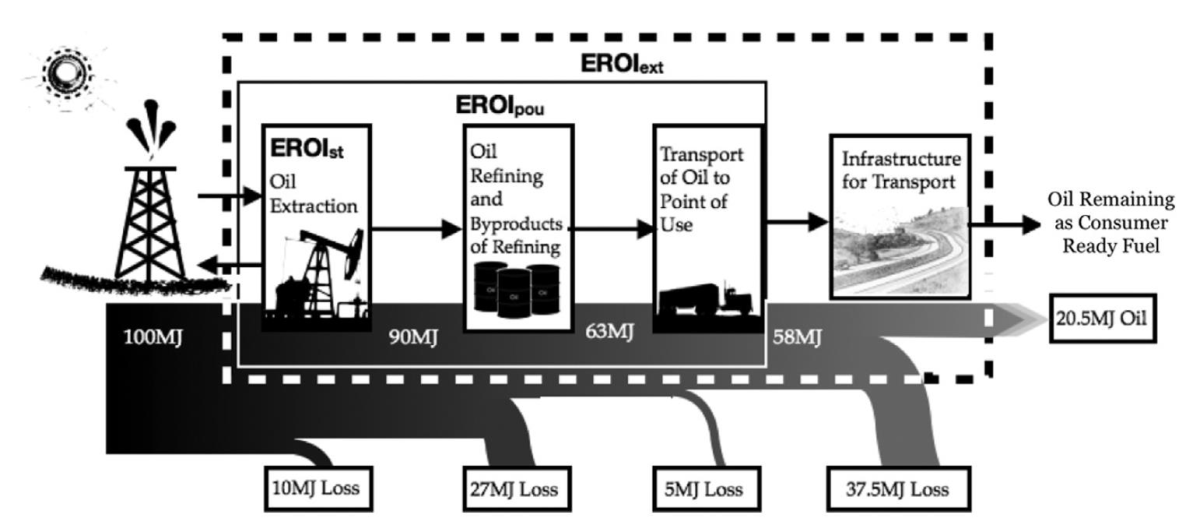
As oil is often extracted together with natural gas, calculations can be tricky
But all estimates tend to show a progressive decrease in EROI for every place where data is available : here in USA
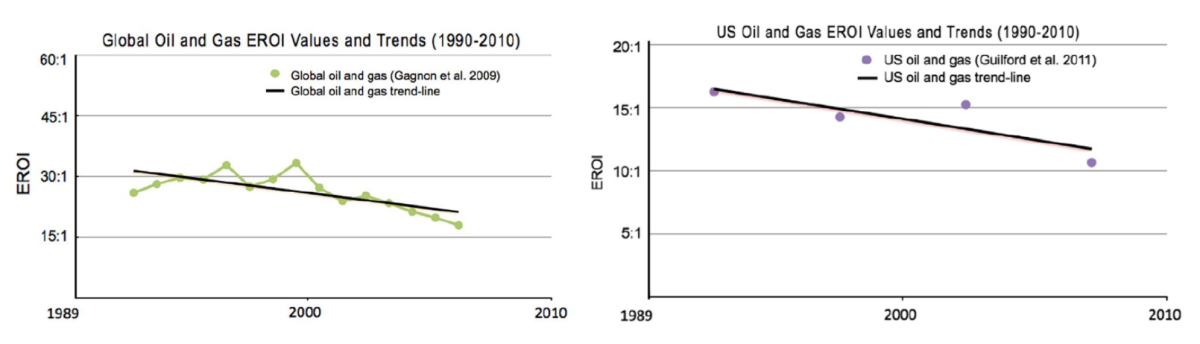
Is there a trend for oil already?
It seems so
All estimates tend to show a progressive decrease in EROI for every place where data is available : here in USA
Is there a trend for oil already?
Pretty much so!
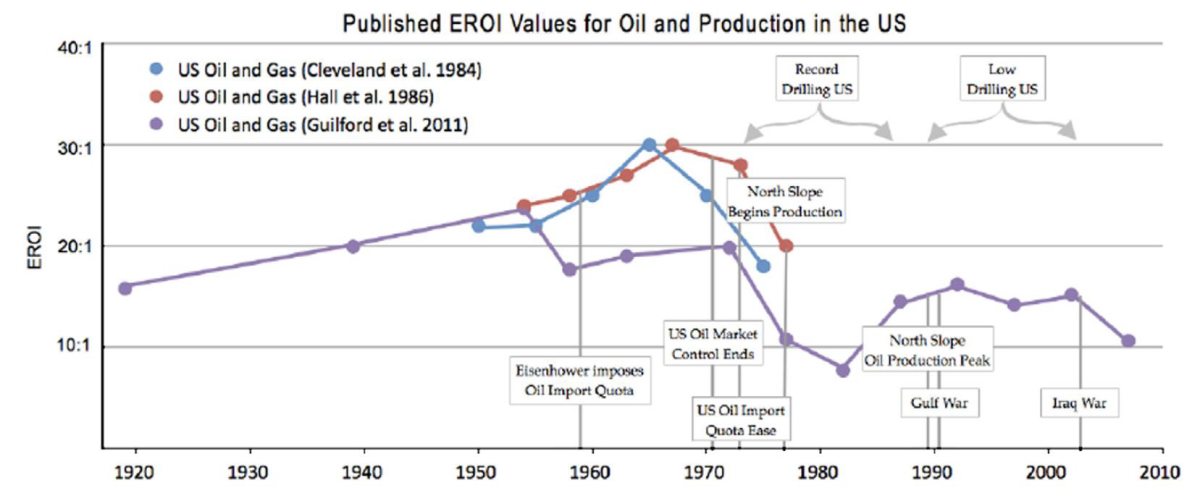
All estimates tend to show a progressive decrease in EROI for every place where data is available : here in Canada
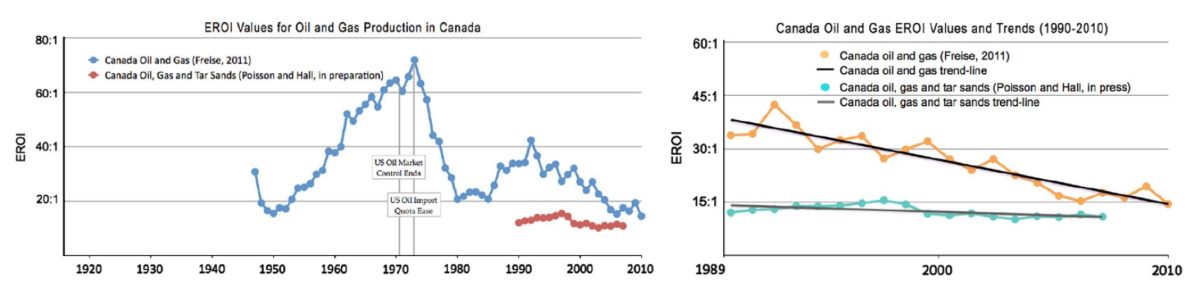
Is there a trend for oil already?
Undeniably so!
All estimates tend to show a progressive decrease in EROI for every place where data is available : here in various other countries
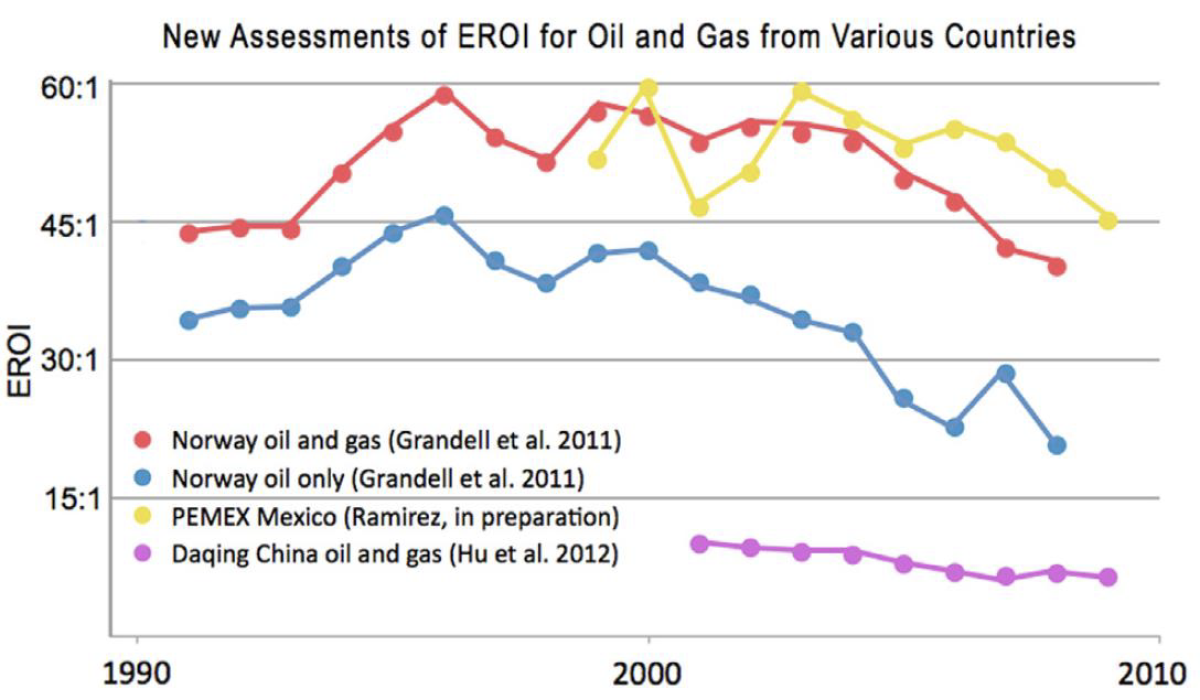
It is logical from what we’ve seen about the concentration of resources in general. But why does it especially matter here?
The decrease of the EROI of conventionnal oil means we’ll need to set aside a growing share of the oil flows just to continue to have a flow
This share of oil « lost » will no longer be used to supply other sectors [36]
Non conventionnal oils have a base EROI quite lower than conventionnal (and will also decrease with their further exploitation) [40]
Managing consequences, tackling causes
[36] MITTEAU, Gilles, 2018. Economie et finance du pétrole -Heu?reka. [online].
[40] HALL, Charles A. S., et al., 2014. EROI of different fuels and the implications for society. DOI 10.1016/j.enpol.2013.05.049.
[33] HCC, 2020. Rapport annuel -Redresser le cap, relancer la transition. Haut Conseil pour le Climat [online]. 2020.
As there is no absolute decoupling, a contraction & instability of economy and as we know it seems unavoidable in the medium-term, regardless of climate change [36] & [40]
By « economy », here, we mean that all socioeconomical & geopolitical relationships will be impacted
Social acceptability of dynamics created by contracting flows will be a key component of the success ofmitigating policies [33]
-> Ecological transition is also a social one
This is were we, as engineers & citizens, have apart to play
We would gain a lot to take inspiration from the 7 principles of low-techs [30]
Challenging needs
Design and produce truly sustainable
Orienting knowledge to resources’ savings
Striking a technical balance between performance & conviviality
Relocalize without losing the right scale effects
De-machinizing services
Knowing to remain modest
[30] BIHOUIX, Philippe, 2014. L’Age des low techs : vers une civilisation techniquement soutenable. Seuil.