The healthcare sector is exerting significant pressure on the environment
Assessing the environmental footprint of the healthcare sector
The healthcare sector, which has to function properly 24 hours a day, 7 days a week, requires a massive mobilisation of material resources. This is all the more true at a time when modern medicine is being deployed, characterised by increasing technologisation and the almost systematic use of medication in medical treatment. These two factors are themselves based on a strong dependence on globalised industries (pharmaceuticals and medical devices) and on globalised distribution logistics to ensure supply.
As in all other sectors of the economy, meeting these material needs necessarily has a major ecological impact. This is linked to industrialised production, which requires the extraction of large quantities of raw materials and the use of energy-intensive and polluting manufacturing and transport processes. The operation of healthcare establishments also requires significant energy consumption for heating buildings, powering equipment and transporting users. Finally, the end-of-life of all consumables also causes pollution, particularly because of the widespread use of single-use products and the lack of appropriate recycling and recovery facilities.
Numerous studies are currently being carried out to better quantify and characterise this impact at various levels: global, national, by establishment, by speciality or by care procedure.
A study published in 2020 in the Lancet Planetary Health provided an assessment of the negative environmental impact of the healthcare sector on a global scale, including multiple indicators. It concluded that the healthcare sector was responsible for 5% of global greenhouse gas emissions, 2% of water consumption and the production of significant air pollution (particularly in the form of fine particles).
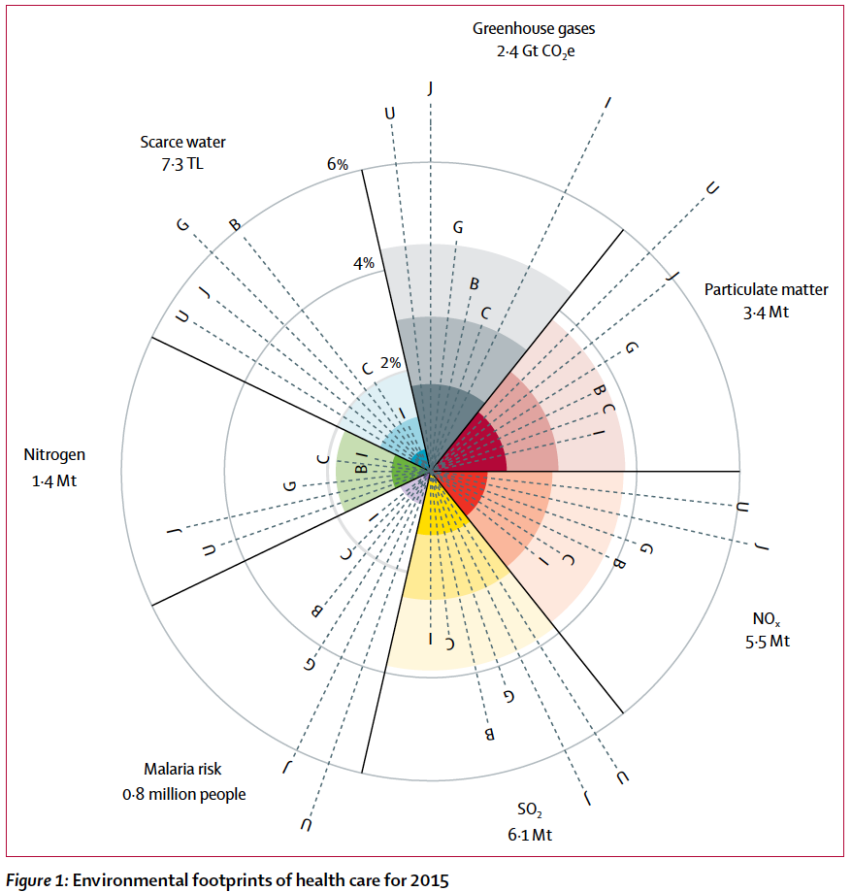
The impact of health care is shown as a percentage of total impact, for the world (segments) and selected countries
(spokes), in terms of greenhouse gas emissions (global total=54·4 Gt CO2e), particulate matter (122·2 Mt),
NOx (161·9 Mt) and SO2 (167·3 Mt) emissions, malaria risk (113·1 million people),28 nitrogen to water (79·0 Mt),29
and scarce water use (483·9 TL).24 Spokes represent data for the USA (U), Japan (J), the UK (G), Brazil (B), China (C),
and India (I). Direct (lightest shade), first-order (middle shade), and supply-chain (darkest shade) refer to impacts
caused by health care directly, by health care’s immediate suppliers, and the remainder, respectively. CO2e=carbon
dioxide equivalent. Gt=gigatons. Mt=megatons. NOx=nitrogen oxides. SO2=sulphur dioxide. TL=teralitres.
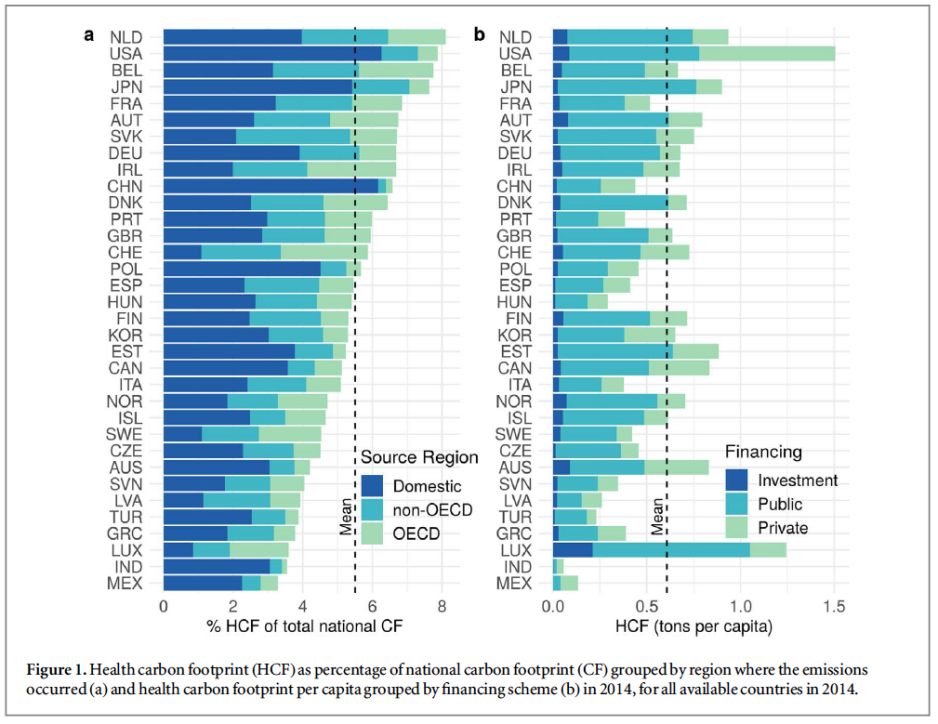
In another study, the authors made an international comparison of GHG emissions from the healthcare sector at state level, showing that these vary and can represent up to 8% of the national carbon footprint. In terms of per capita emissions, the disparities are even greater, ranging from 0.06 tonnes of CO2eq in India to 1.5 tonnes of CO2eq in the United States (with an average per capita carbon footprint of 0.6 tCO2eq in the sample of countries studied). A statistical analysis showed that the carbon intensity of the domestic energy system, the energy intensity of the domestic economy and healthcare expenditure together explain half of the variance in the per capita carbon footprints of the healthcare sector.
Zoom: the carbon footprint of the French healthcare sector
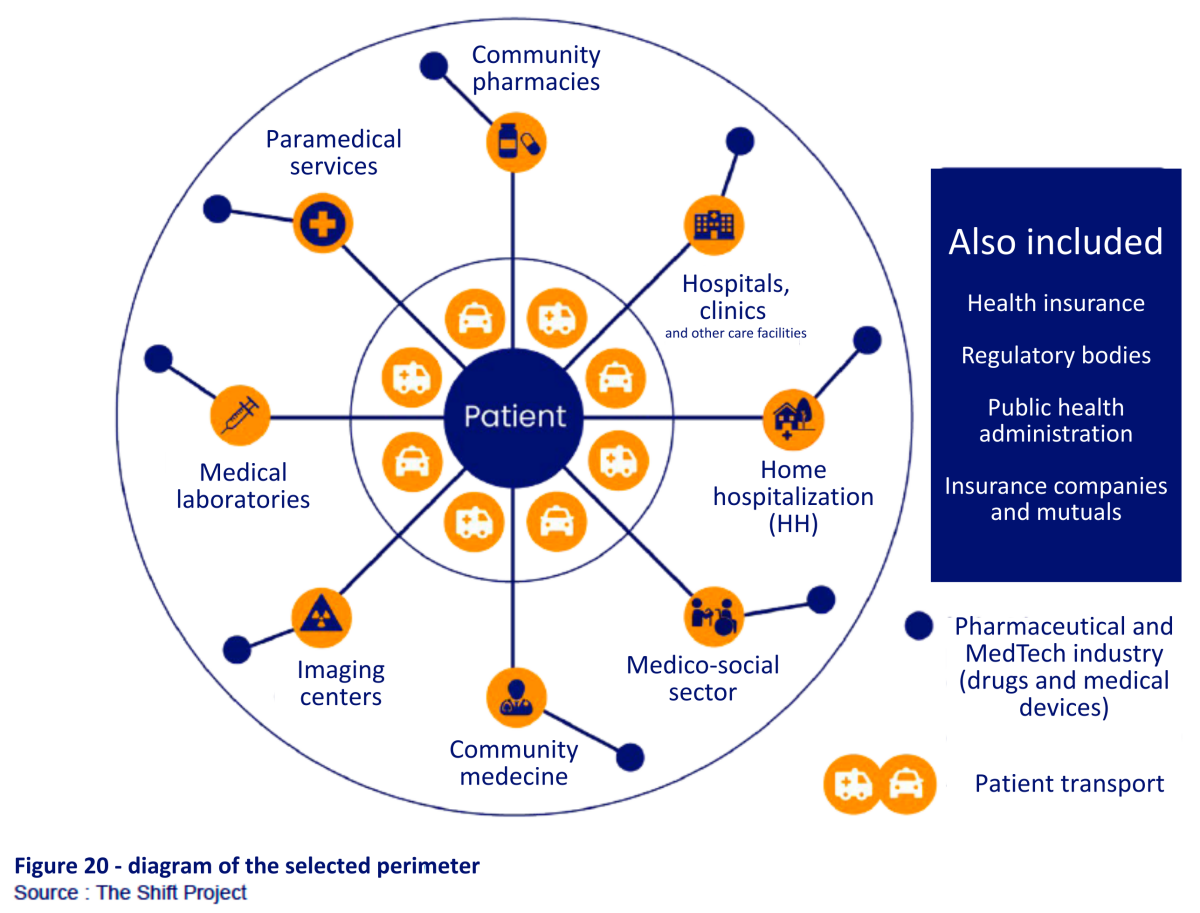
In a report published in 2023 entitled ‘Decarbonising Healthcare for Sustainable Care’, the French think tank The Shift Project, whose mission is to inform and influence the debate on the energy and climate transition in Europe, proposes an assessment of the carbon footprint of the healthcare sector in France.
The aim of this analysis is to gain a better understanding of the environmental impact of a sector that is vital to the smooth running of society, and which plays a major economic role. In 2018, healthcare expenditure accounted for 11.3% of French GDP, and the sector directly employed more than 2.6 million people.
The scope of this carbon footprint includes the entire medical sector, public healthcare institutions and complementary healthcare structures. The pharmaceutical industries, as well as the supply chain necessary for the sector's operation, are indirectly included through the purchases made by the sector.
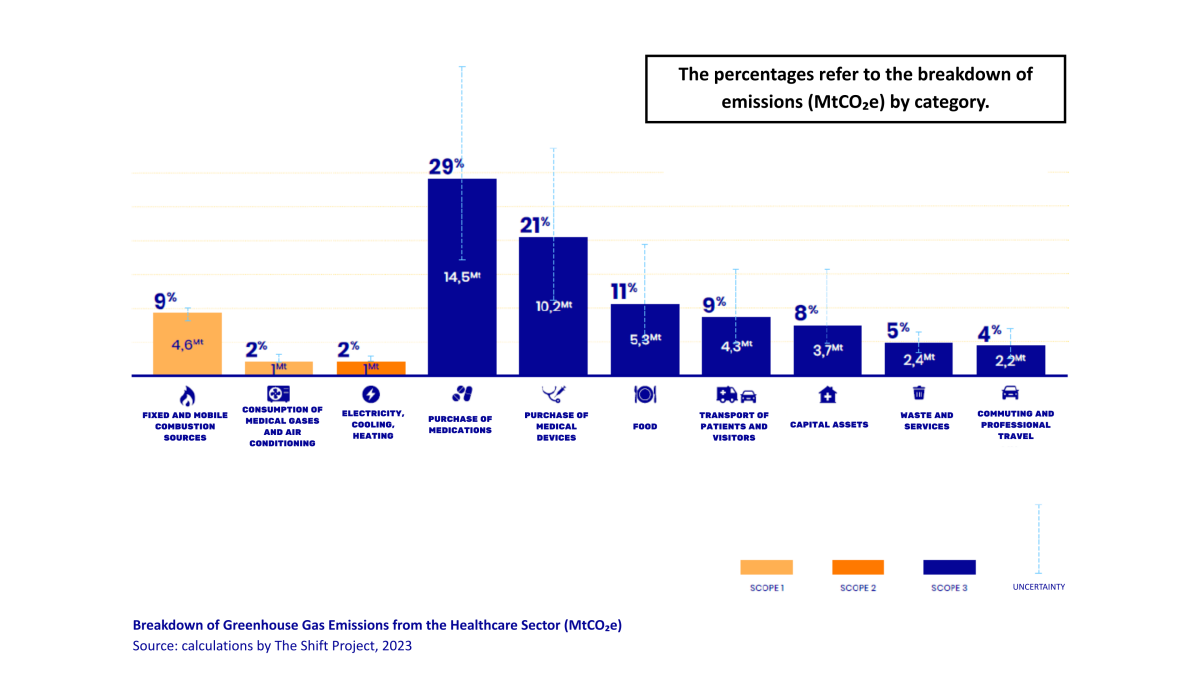
The results show that the impact of the healthcare system on climate change is significant, with emissions representing around 49 million tonnes of CO2e, or 8% of national emissions. An analysis of the uncertainties suggests that these emissions vary between 40 and 61 million tonnes of CO2e, corresponding to between 6.6% and 10% of the national carbon footprint, with a confidence interval of 95%.
Here are the main conclusions concerning the sources of emissions and their breakdown by sector:
Purchases of medicines, reagents and medical devices account for around half of the emissions from the healthcare sector.
Food, particularly through catering, is also a major source of emissions, accounting for 11% of total emissions (3rd source of emissions).
The consumption of fuel oil and gas for uses such as heating and the production of domestic hot water accounts for 11% of emissions.
Other sources of emissions, less specific to the healthcare sector, include travel (13%) and fixed assets used over several years (buildings, vehicles, machinery, IT systems and furniture), which account for 8% of emissions.
So-called ‘fugitive’ emissions account for 2% of the healthcare sector's total footprint (around 1 MtCO2e), and are mainly linked to refrigerant gases (0.5 MtCO2e), inhalers (0.3 MtCO2e) and medical gases (0.3 MtCO2e).
Emissions associated with waste treatment are low, representing less than 1% of the healthcare sector's carbon footprint.
The healthcare sector: a major source of chemical pollution
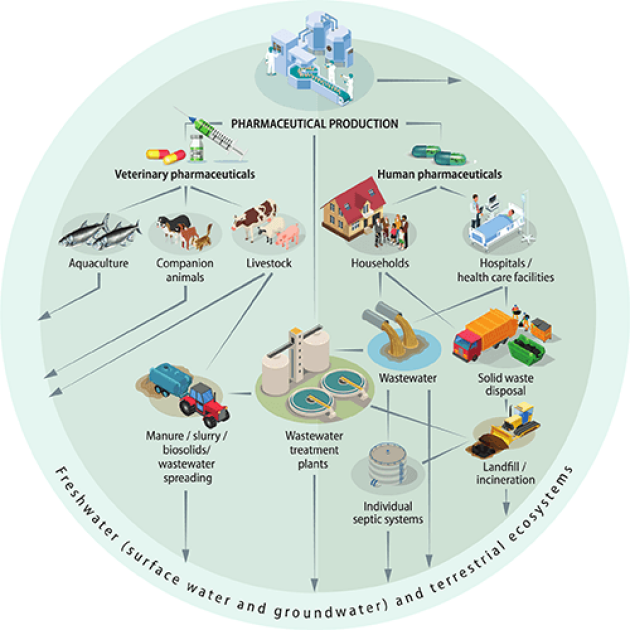
Worldwide, around 4,000 active pharmaceutical ingredients (APIs) are used in medicines for human and veterinary health. These substances are found in various environments: in water (surface, ground and drinking), in soil, and in the living organisms (flora and fauna) of exposed ecosystems.
Medicines are designed to interact with living organisms at low doses, which means that even small quantities in the environment can have unexpected negative effects on the balance of ecosystems and human health. For example, certain substances in oral contraceptives have caused the feminisation of fish and amphibians. Other drugs, such as fluoxetine (used in psychiatric treatments), modify the behaviour of fish, making them less cautious and more vulnerable to predators. In addition, the excessive use and release of antibiotics into aquatic environments is exacerbating the problem of antibiotic resistance, an increasingly pressing global health threat that could cause more deaths worldwide than cancer by 2050.
Active pharmaceutical ingredients are emitted into the environment at every stage of their life cycle: during manufacture, use and disposal. Although the scale of emissions varies according to region and type of drug, the main sources of pollution are untreated domestic wastewater and effluent from municipal wastewater treatment plants. Manufacturing plants, intensive agriculture and aquaculture can also be local sources of API pollution. For example, when veterinary drugs are used in animal husbandry and manure is used as a fertiliser, they are released into the soil and the wider environment. This results in both soil contamination and biomagnification through uptake of the drugs into crop plants.
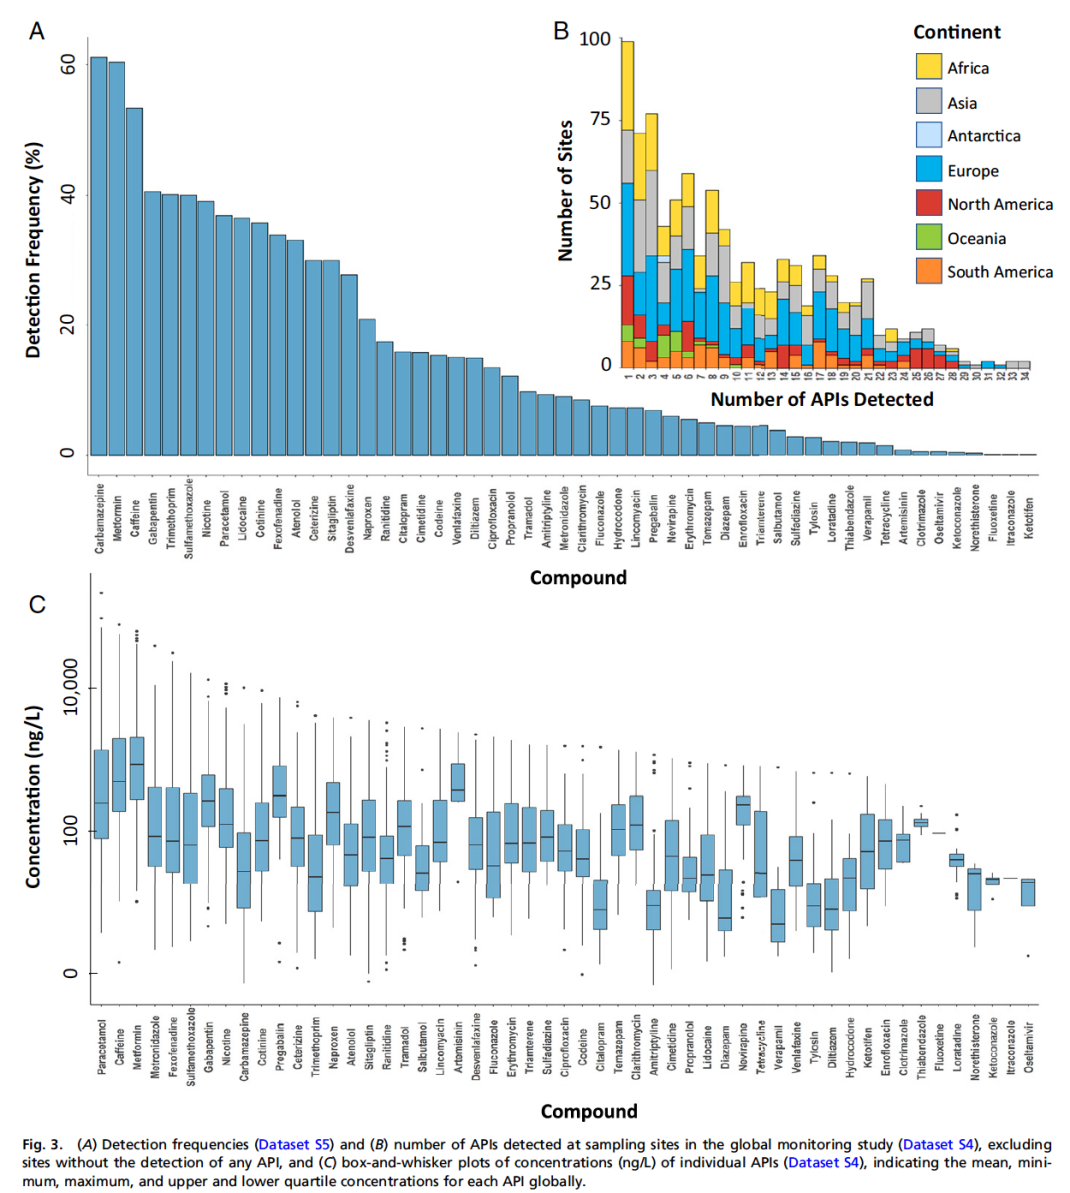
To gain a better understanding of the scale of the problem, an international research team has conducted a global study of river pollution by active pharmaceutical ingredients (APIs). Samples were collected from 1,052 sites along 258 rivers in 104 countries, covering every continent and representing a population of 471.4 million people. A total of 61 IPAs were analysed.
Here are the main conclusions of the study:
The highest cumulative concentrations of API were found in sub-Saharan Africa, South Asia and South America. The most contaminated sites were mainly in low- and middle-income countries, often characterised by poor wastewater and waste management, as well as the presence of pharmaceutical industries.
The most frequently detected APIs were carbamazepine (an anti-epileptic), metformin (an oral anti-diabetic) and caffeine (also linked to certain lifestyle habits), which were found at more than half of the sites monitored.
In 25.7% of the sites sampled, concentrations of at least one API exceeded levels considered safe for aquatic organisms, or were of concern because of their potential to promote antimicrobial resistance.
These results show that the presence of these contaminants in surface water poses a threat to environmental and/or human health in more than a quarter of the sites studied worldwide.