Climate change indicators
Objectives
Know the main indicators of climate change
Follow a forward-looking approach on climate change
Understand the consequences of climate change and mitigation and adaptation strategies
Introductory video on climate change indicators:
https://youtu.be/gcoTOCOrzCo
What are the main indicators of climate change?
What information they give us?
1) First indicator: Earth temperature
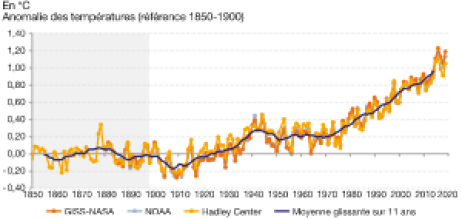
Evolution of the annual average temperature
The warming since the mid-18th century is estimated to be around 1.1 degrees Celsius. The surface temperature has increased by 0.1 degrees Celsius every 5 to 6 years since the 1970s. 2015, 2016, 2017 and 2018 are the four hottest years on record.
Paris Agreement
To limit the effects of climate change, the signatory countries of the United Nations Framework Convention on Climate Change (UNFCCC) have set themselves the objective in the 2015 Paris Agreement to "Contain the rise in the average temperature of the planet below 2 ° C compared to pre-industrial levels ”.
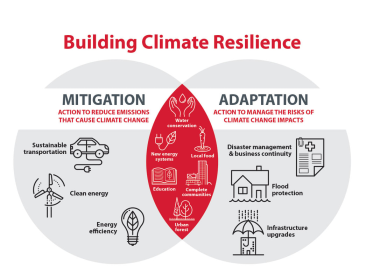
Mitigation and adaptation:
In order to limit the temperature rise, a mitigation strategy has been adopted. It consists of slowing down the causes of climate change by limiting net greenhouse gas (GHG) emissions.
However, given the long lifespan of greenhouse gases accumulated in the atmosphere, the increase in temperatures by the end of the century is inevitable and all regions of the world are concerned. A climate change adaptation strategy is therefore necessary to limit its consequences on our environment.
The objectives of adaptation are to anticipate the impacts of climate change and limit their possible damage by intervening on the factors that control their magnitude (for example, the urbanization of risk areas).
2) Second indicator: CO2 level in the atmosphere
Graph of the evolution of CO2 in the atmosphere
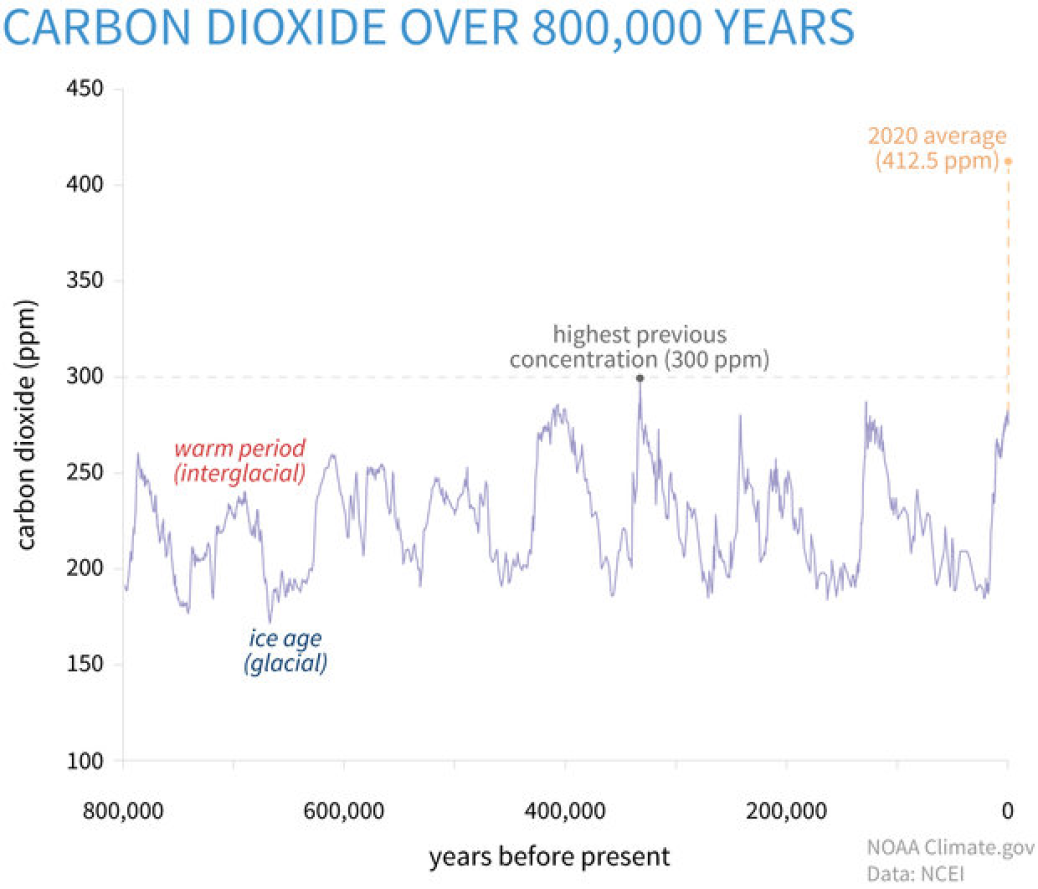
The concentration of CO2 in the atmosphere is a good indicator of climate change. It is evaluated in ppm CO2 (parts per million) which is the fraction equal to 10–6, ie one millionth. 1ppm of CO2 is equivalent to saying that there is 1 molecule of CO2 for 1 million molecules of other gases (= 1mg of CO2 / 1 kg of gas).
On the first graph, we see the evolution of the CO2 concentration over the last 800,000 years. From the beginning of human civilization (-3500) until 200 years, our atmosphere oscillated between 180 and 280ppm of CO2. This level allowed the maintenance of living conditions conducive to the development of our species. In order to contain the rise in temperatures to less than + 2 ° C, it is estimated that the safety level would be 350ppm of CO2 in the atmosphere.
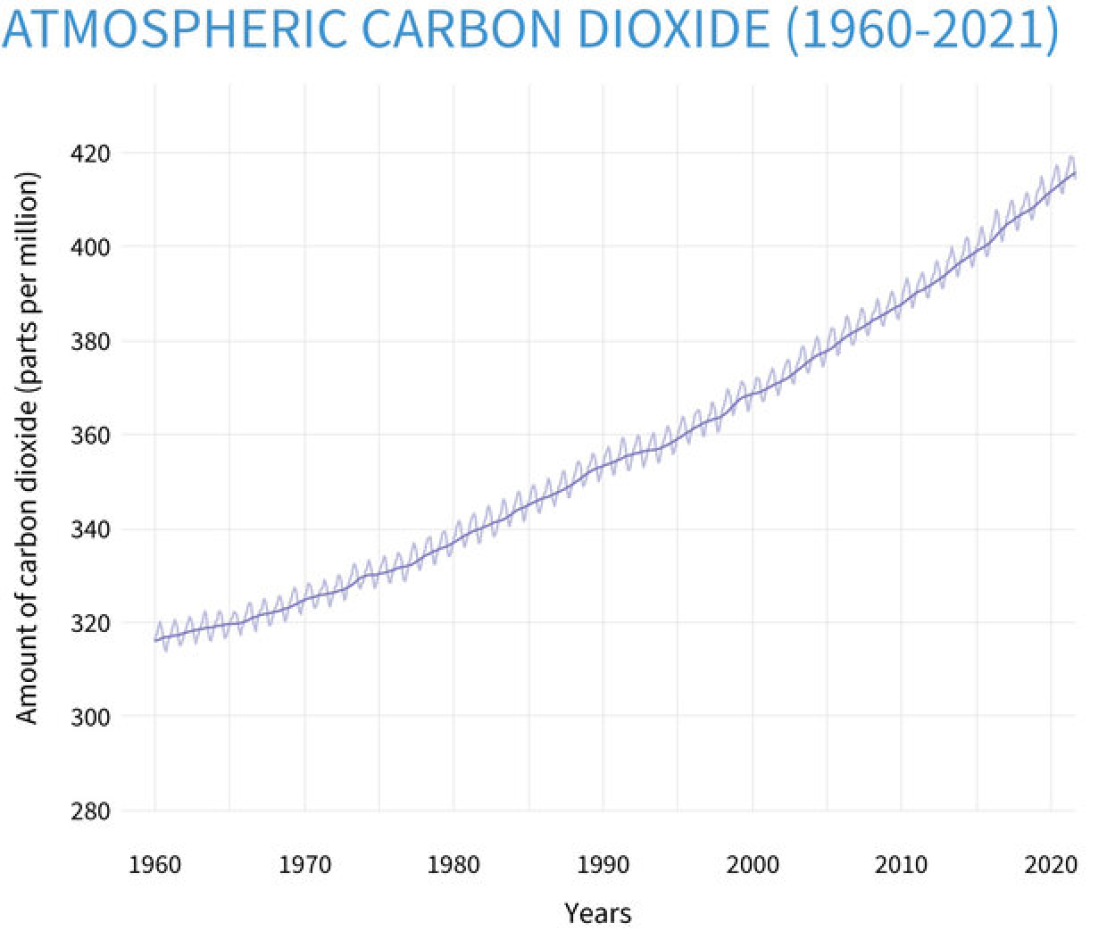
The second graph shows the evolution of the CO2 concentration between 1960 and 2020. We then notice a very clear increase in the concentration in recent years with a rate of 320 ppm in 1960 which exceeds the threshold of 405 ppm in 2017.
Global CO2 emissions per year now exceed 40 GtCO2 per year (41.5 GtCO2 in 2018).
3) Other indicators of climate change
Ocean warming, melting ice and sea level
The oceans absorb 94% of the heat linked to the increase in CO2, causing the Arctic and Antarctic ice to melt and the sea level to rise.
According to the IPCC, the rate of sea level rise has accelerated in recent decades to reach nearly 3.2mm per year over the period 1993-2010. This rise in the level of the oceans results in the retreat of the coastline and the disappearance of low-altitude island territories.
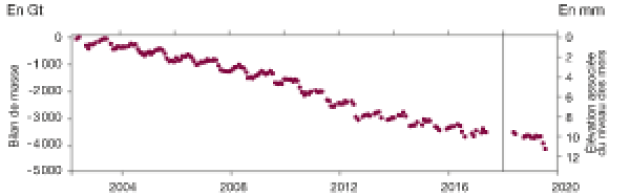
GREENLAND ICE MASS BALANCE FROM 2002 TO 2019
The polar regions are losing ice and this loss accelerated in the 2000s. Between 2002 and 2019, the mass of the Greenland ice sheet shrank by an average of 268 ± 11 gigatons per year (Gt / year) . During the unusually warm arctic summer of 2019, Greenland lost 600Gt of ice, equivalent to a sea level rise of 2.2mm.
source: GRACE, GRACE-FO. Processing: Danish Meteorological Institute, GEUS, DTU Space
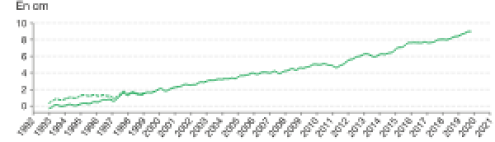
EVOLUTION OF THE AVERAGE LEVEL OF THE GLOBE SEAS SINCE 1993:
The average sea level rose by 1.7 ± 0.3 mm / year over the period 1901-2010. The rate of sea level rise has accelerated in recent decades to reach 3.3 ± 0.4 mm / year over the period 1993-2019 (satellite measurements). About 30% of sea level rise is due to expansion caused by increasing water temperature.
Source: E.U. Copernicus Marine Service Information
Ocean acidity
The increased concentration of CO2 in the atmosphere also results in a higher concentration of CO2 in the ocean. As a result, seawater becomes acidic because on contact with water, CO2 turns into carbonic acid. From 1751 to 2004, the pH (potential hydrogen) of the surface waters of the oceans decreased from 8.25 to 8.14. This acidification represents a major risk for coral reefs and certain types of plankton threatening the balance of many ecosystems.
Create your own prospective scenario:
Interactive climate calculator developed for educational purposes by a team from Climate Interactive, MIT, Ventana Systems, UML Climate Change Initiative and Todd Fincannon:
Other impacts of climate change
The IPCC also assesses how climate change will translate in the medium and long term. He plans :
Aggravated climatic phenomena: changes in the climate are modifying the frequency, intensity, geographical distribution and duration of extreme weather events (storms, floods, droughts).
A disruption of many ecosystems: with the extinction of 20 to 30% of animal and plant species and significant consequences for human settlements.
Crises linked to food resources: in many parts of the world (Asia, Africa, tropical and subtropical zones), agricultural production could fall, causing serious food crises, sources of conflict and migration.
Health dangers: climate change will likely have direct impacts on the functioning of ecosystems and on the transmission of animal diseases, which may present pathogenic elements that are potentially dangerous for humans.
Population displacements: the increase in sea level (26 to 98 cm by 2100, depending on the scenarios) should cause the flooding of certain coastal areas (in particular the deltas in Africa and Asia), or even disappearance entire island countries (Maldives, Tuvalu), causing significant migrations.
Source: https://www.ecologie.gouv.fr/comprendre-giec
Conclusion
Since the 19th century, humans have dramatically increased the amount of greenhouse gases in the atmosphere. As a result, the natural climate balance is altered and the climate is readjusted by a warming of the earth's surface. We can already see the effects of climate change. This is why we must mobilize and act. Everyone is concerned: elected officials, economic players, citizens, to reduce our greenhouse gas emissions, but also to adapt to the changes already underway.