Abiotic ressources
Introduction
Définition : « Abiotic ressources » [1]
Firstly, biotic resources refers to ressources coming from living things, or more precisely, organic matter. Ex: animals, plants.
Consequently, abiotic resources refers to all ressources but biotic ones. So, it encompasses minerals, but also air, water, sunlight, etc.
Fossil fuels can be classified either as biotic or abiotic resources, depending on the timescale considered. Indeed they’re coming from living things, resulting of bio-geo- chemical cycles, but were definitvely formed milllion years ago. In EV14, we’ll consider them as abiotic.
But what even are « resources »? [1]
Surprisingly, it is not often explicitly defined, even in major texts. Ex: ISO 14040 norm (giving framework for all Life-cycle analysis), or the classical 1983 report of the United Nations.
Analysis of varied definitions highlights some converging points: a resource is considered as such if :
It has an value or utility (from material properties for an industrial process to cultural valorization of precious stones)
For a certain subject (generally considered: the humans)
[1] BEYLOT, A. et al, 2020. DOI 10.1016/j.resconrec.2020.104748
General caracterizations
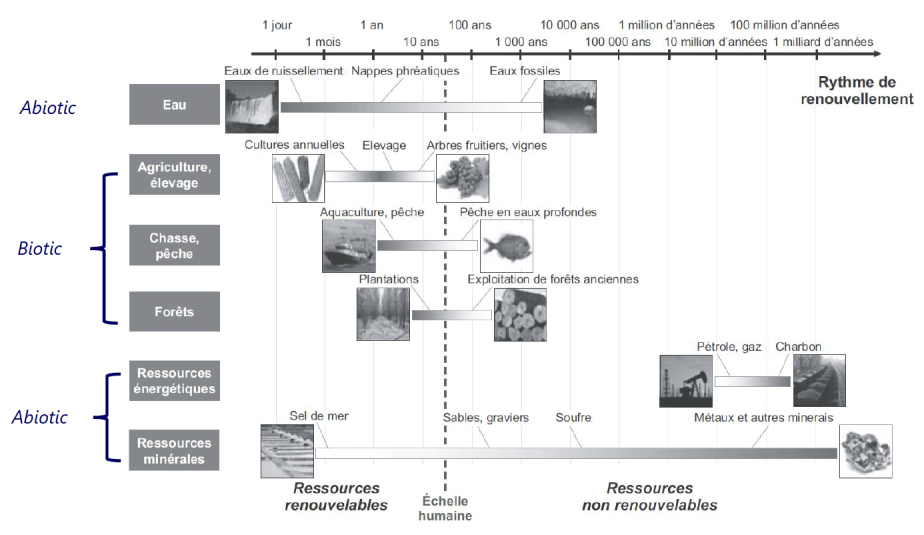
The renewable/non-renewable polarity [2]
Renewable when the stock reconstitutes itself at a « sufficiently quick rate ». Usual threshold: timespan of a human life.
Non-renewable when they constitute themselves on a long period of time, way longer than a human life. Their use is always a depletion in available stocks.
[2] Resource, 2020. Wikipedia[online].
[3] BIHOUIX, P., GUILLEBON, B., 2010. Quel futur pour les métaux.
The availability/non-availabilitypolarity
Available when concentration and position let them be technically AND economically usable by humans.
More or less available according to the variation of these dimensions. Ex: Oil shale in the XXth, depending on stocks’ concentrations and competition with conventional crude oil. [4]and [5]
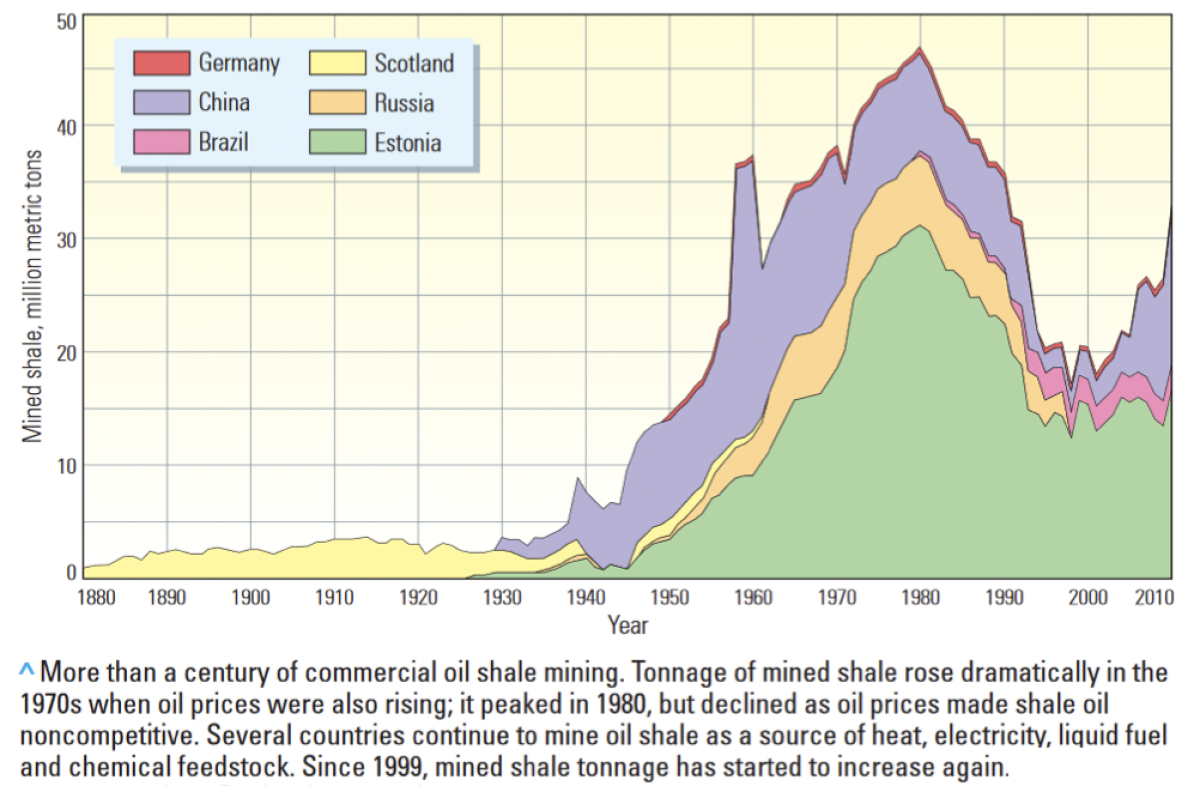
[4] History of the oil shale industry, 2020. Wikipedia [online].
[5] Allix et al., 2010. Coaxing Oil from Shale. Oilfield Review [online]. 2011.
[6] BP, 2020. BP Statistical Review of World Energy. [online]. 2020
Médias
Consomption of abiotic resources
Main threads of the course : Metals and Oil
Metals
Brief global history
Contemporary trends
Oil :
Brief global history
Contemporary trends
Sociotechnical perspective (Tutorial work)
Main threads of the course
The mineral resource example: Metals
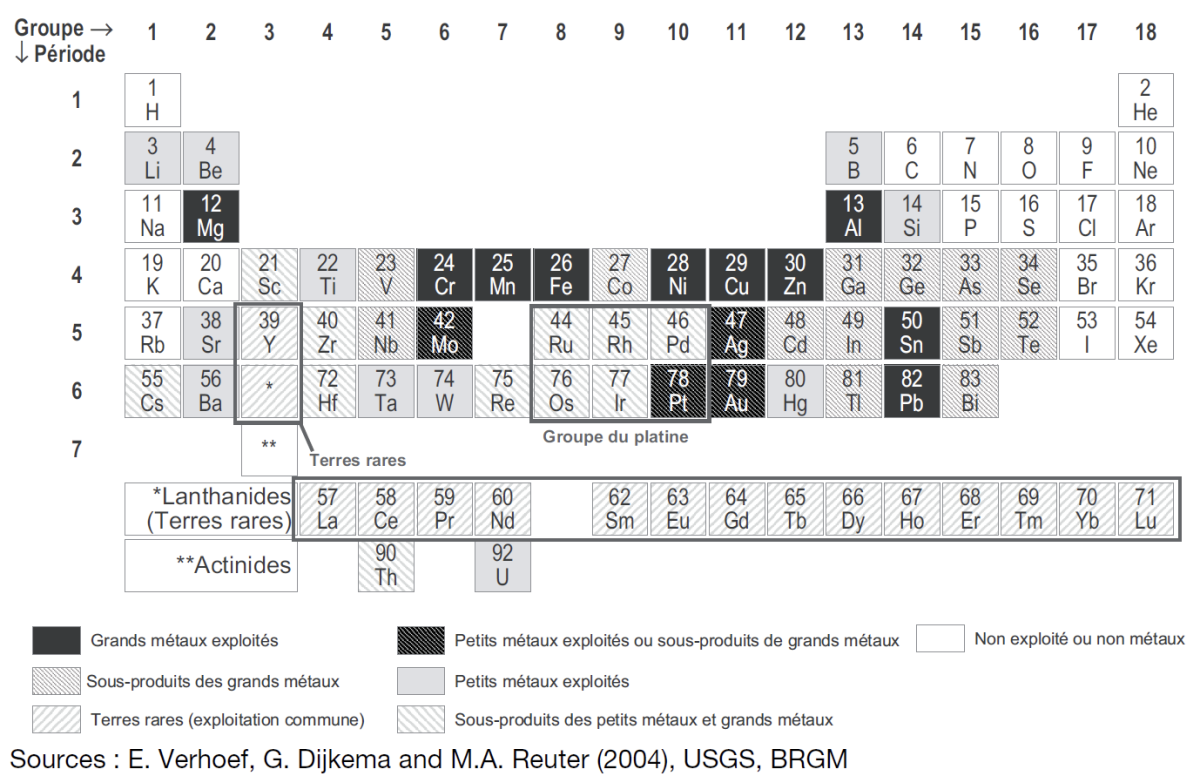
Why metals? On the 118 known atoms, most of them are metals :[3]
85 metals
6 metalloids
17 non metals
10 non determined
General properties :
electrical & thermal conductors
mechanical ductility
Geological forms: oxides (common) > sulfides (less common) > natives (uncommon)
The energetical resource example: Oil
Currently, most used source in main primary energy consomption :
Oil (33,1%)
Coal (27%)
Natural gas (24,2%) [6]
Regroup varied forms of derived fuels (petrol, shale oil) and secondary resources
General properties: gives a lot of secondary resources when refined, good energy density, easy and convenient to transport and to use as energy vector in varied contexts
Metals
Metals global history
A very brief summary [3]
Contrary to first intuition: native metals were the first to be used. Although uncommon (often mixed) they were ealily recognizable:
Copper (at least 8000 BC, and melted since 4000 BC), Gold and Silver (4000 BC)
Alloys starting in 2500 BC with Bronze (Tin & Copper)
Furnaces since at least 1000 BC let reduce oxides (notably, Iron oxide) and developp experiments on alloys (Steel = Iron + Carbon)
Lead, Antimony, Mercury used pure or in allows during Antiquity
This tiny number of metals has constituted the main uses until the XIXth century and structured economical and geopolitical relationships between populations
Besides native platinum in Peru, other metals like Nickel, Zinc, Cobalt have been identified by chemistry and metallurgy (beginning of XVIIIth). And then: Manganese, Molybdenum, Tungsten, Titanium (end of the XVIIIth).
Electrolysis in XIXth allows to separate most elements in pure form, but weak rate of use until the XXth century.
Contemporary trends
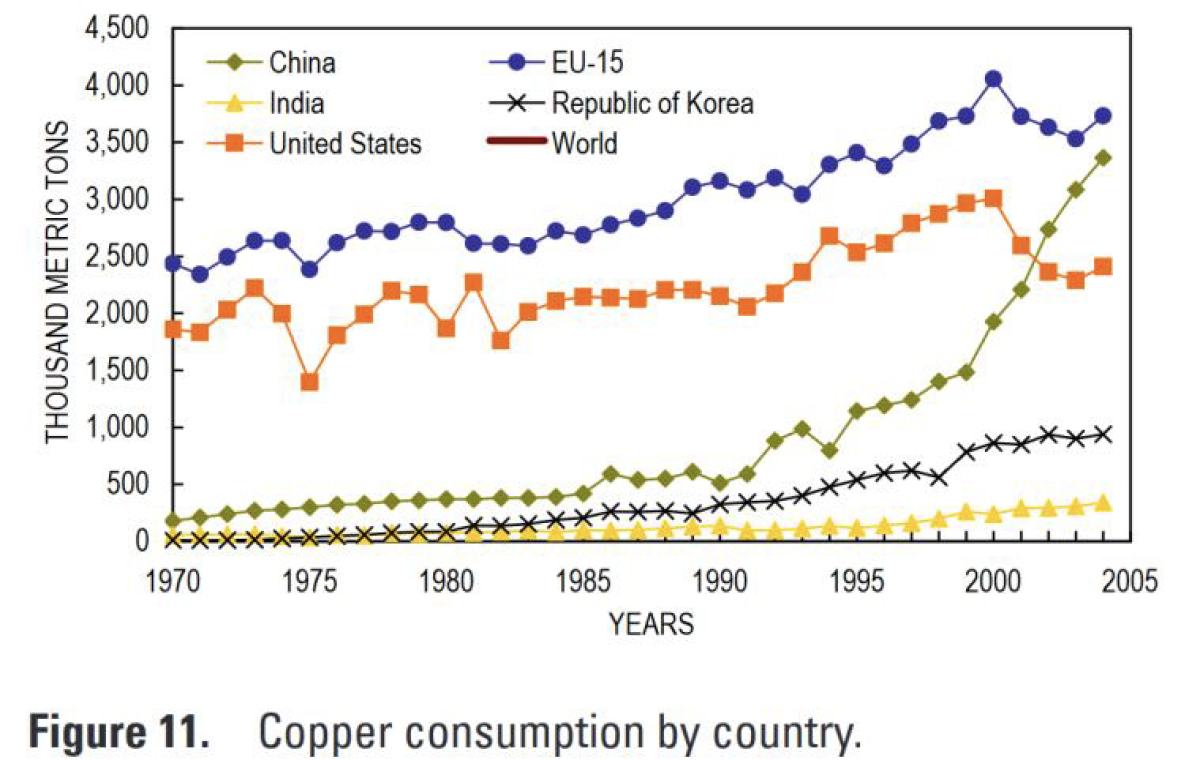
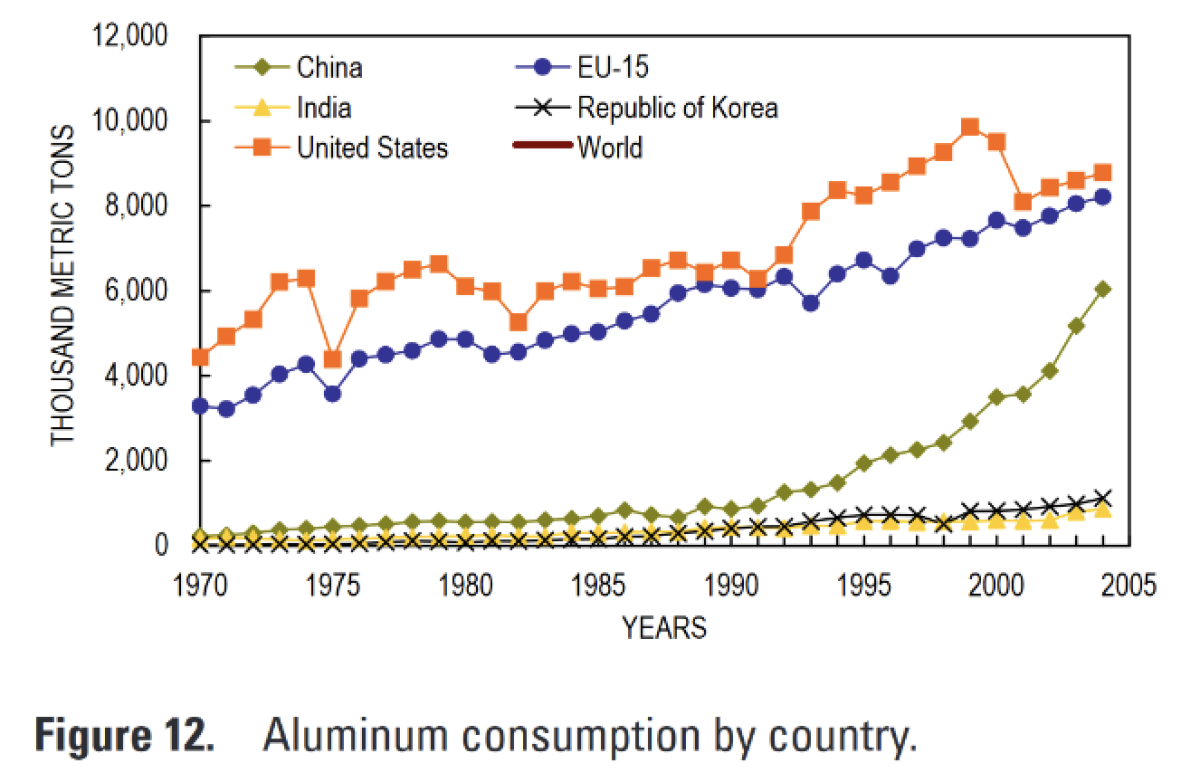
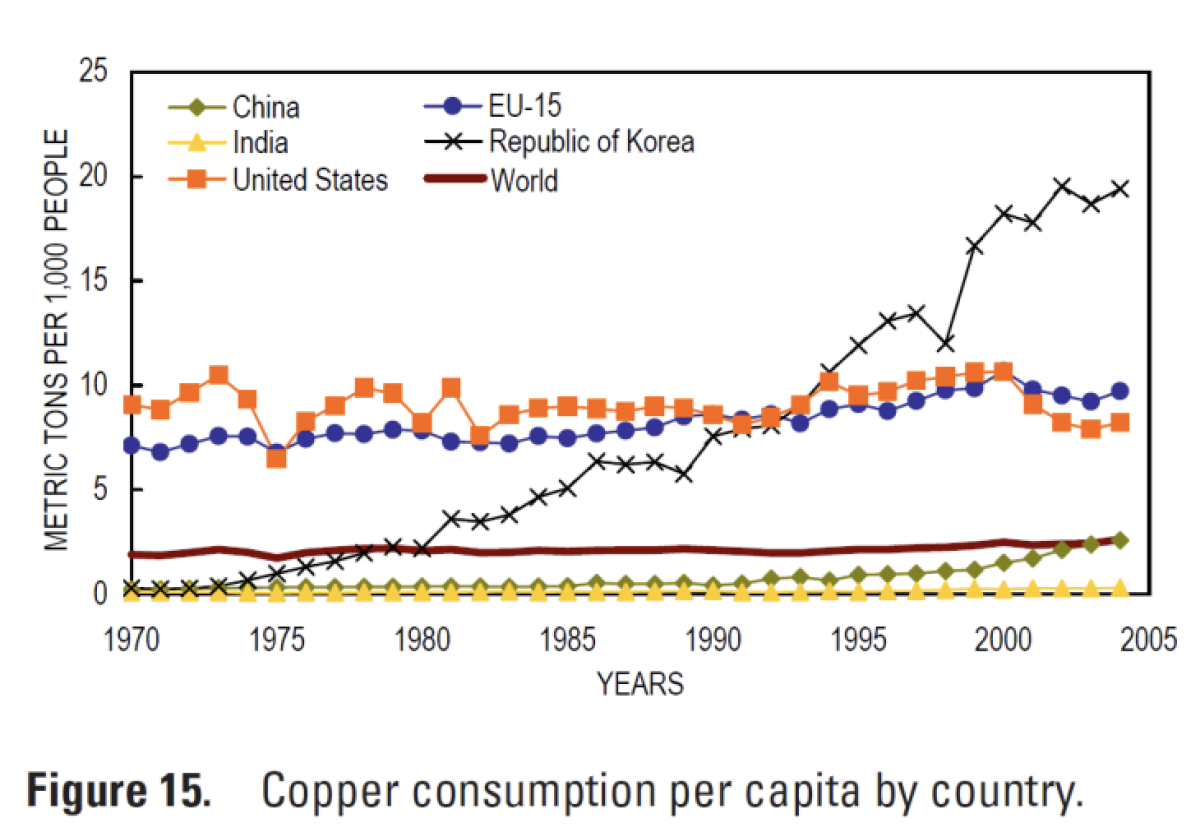
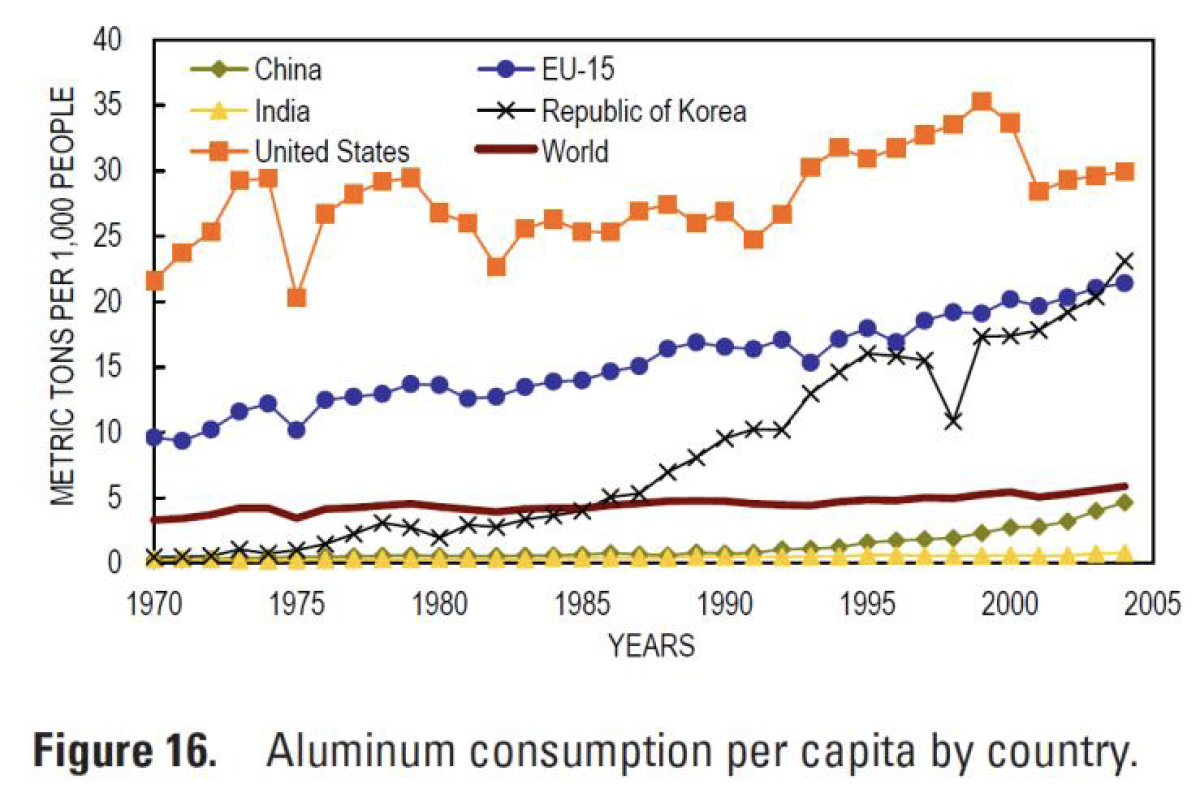
Continuous growth in use of base metals
Extracted from [7]
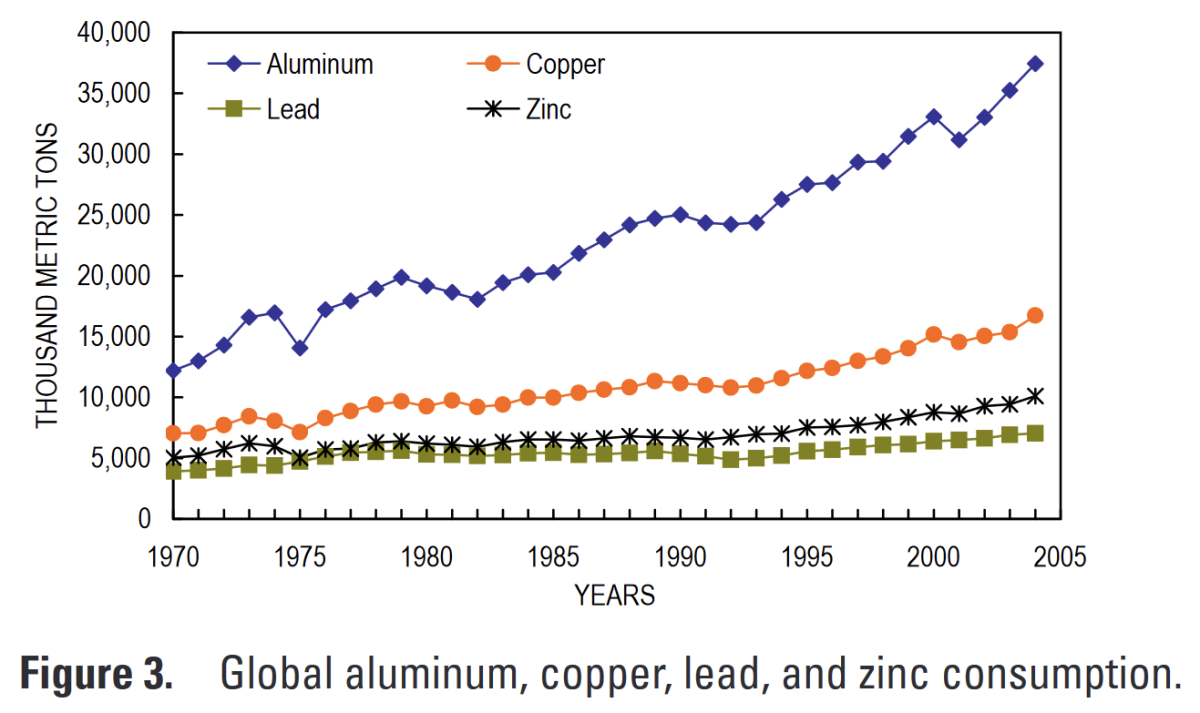
Heterogeneous rise of world consumption for base metals: by a factor from 1,5 (Lead) to 3 (Alumunium)
Extracted from [7]
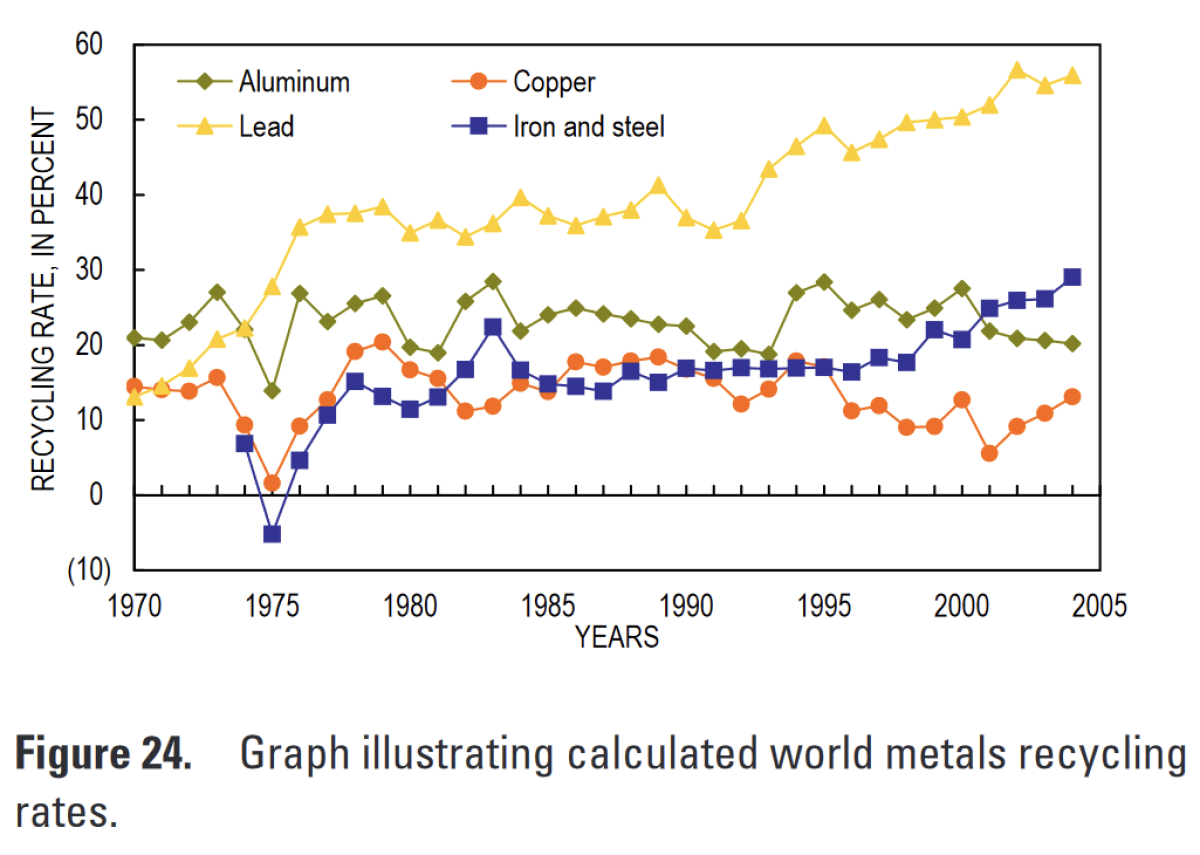
Recycling rates not progressing as much
[7] ROGISH, D.G., and MATOS, G.R., 2008, The global flows of metals and minerals: USGS Open-File Report 2008–1355
Countries high disparities
Extracted from [7]
Extracted from [7]
Extracted from [7]
Extracted from [7]
Global Extraction/Consomption pattern

Figure 18. Consumption and extraction in the European Union group of 15 countries (EU-15). A, Base metals. B, Iron and steel.

Figure 20. Consumption and extraction in South America. A, Base metals. B, Iron and steel.
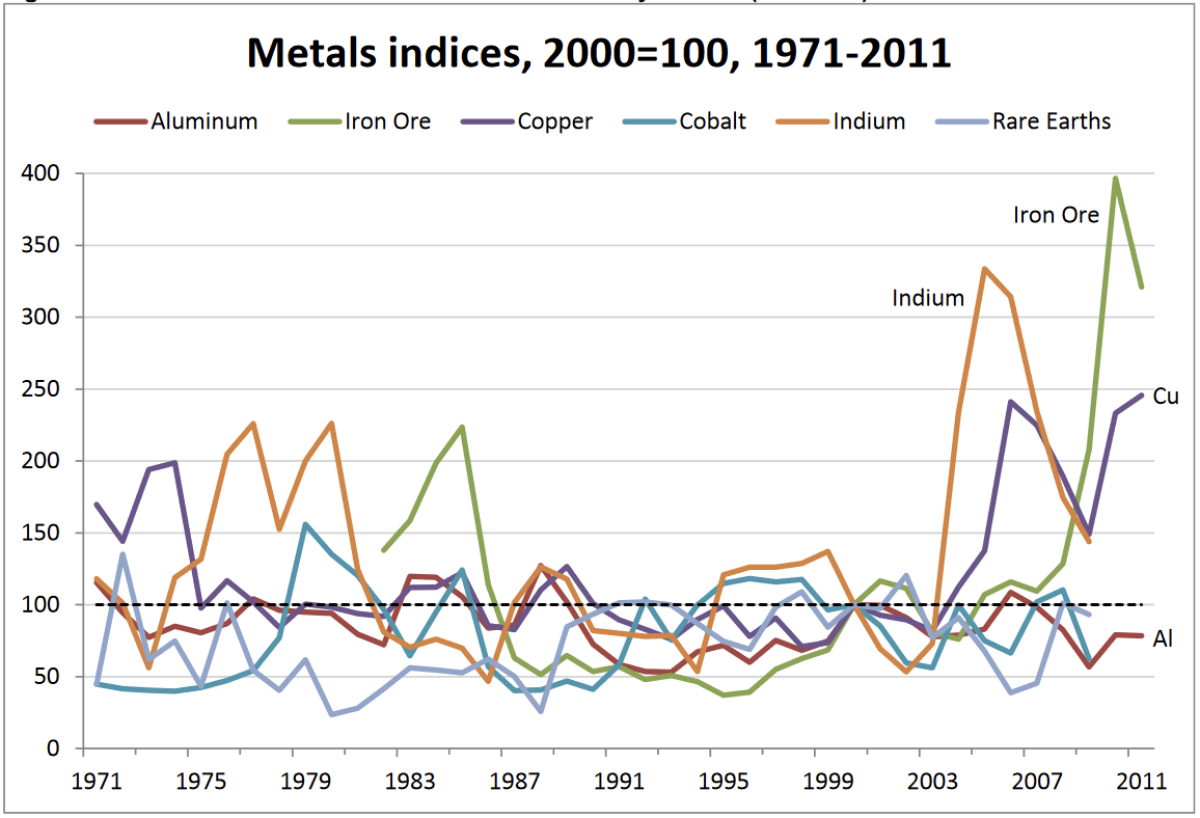
Growing variety of metals for expanding specific uses
Adapted from [3]

Medias
Oil
Oil global history
A very brief summary [8]
Oil has been used for a long time in varied forms
Used as fuel as back as 400 BC in China
Used for lighting or in the asphalt form for construction as back as 2000 BC in Babylon
Crude oil already distilled by Persian chemist in 9th century to obtain tar, used for streets’ paving
Distillation arrive in Europe in 12th century through Islamic Spain
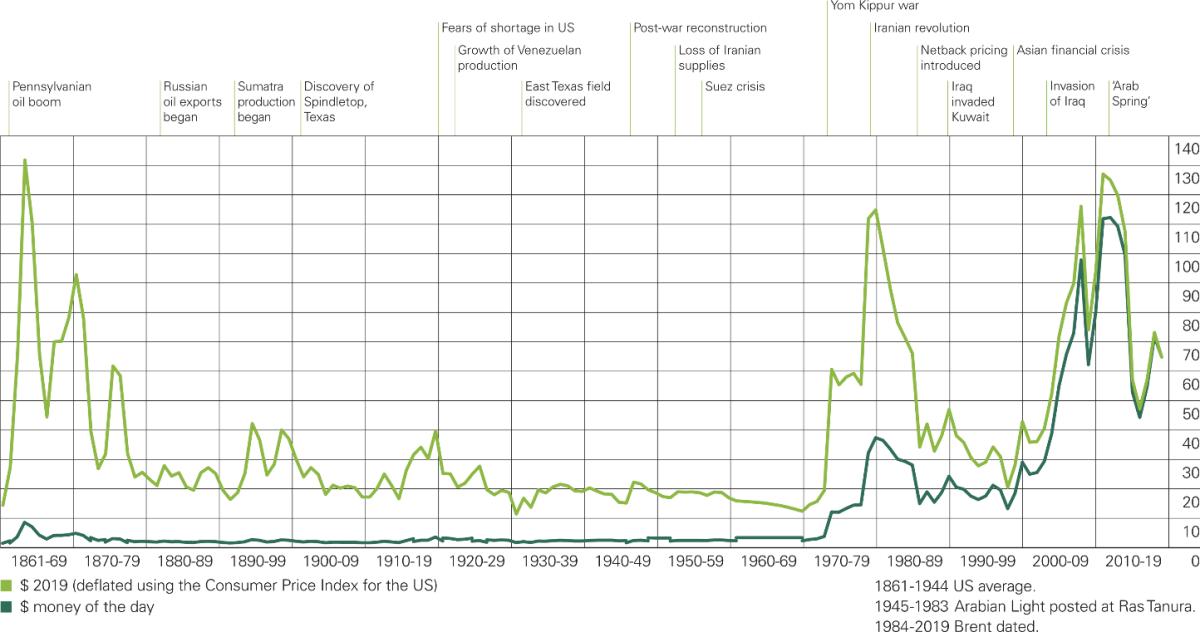
The mid19th –early20th turning point [9]
First industrial oil well and oil refinery around 1850
Consomption stayed low (5% of world energy in 1910), as oil as not that interesting at first, compared to wind or animals for transport, solar& coal were largely dominant for thermal power, etc.
Complex and crossing technical but mostly political phenomena let oil grew in varied uses, to represent more than60% of world energy as soon as 1970
[8] Petroleum, 2020. Wikipedia[online].
[9] BONNEUIL, C., FRESSOZ, J-B, 2016. The Shock of the Anthropocene. The Earth, History and Us.
Contemporary trends
No primary energy transition
Oil’s share in primary energy is steadily decreasing for more than30 years, but:
Oilisstillthe dominant energyvector
In absolute quantity, it is not declining at all, as for all energy vectors!
Extracted from [6]
[6] BP, 2020. BP Statistical Review of World Energy. [online].
Three main profiles
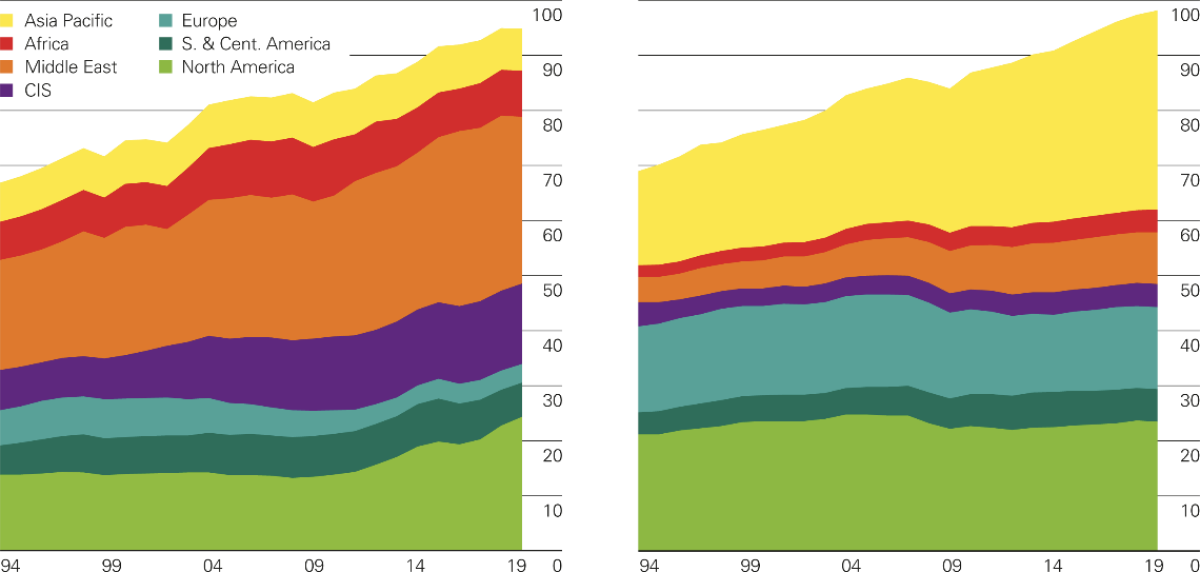
High ratio of Production/Consomption
Low ratio of Production/Consomption
Ratio of Production/Consomption near 1
Extracted from [6]
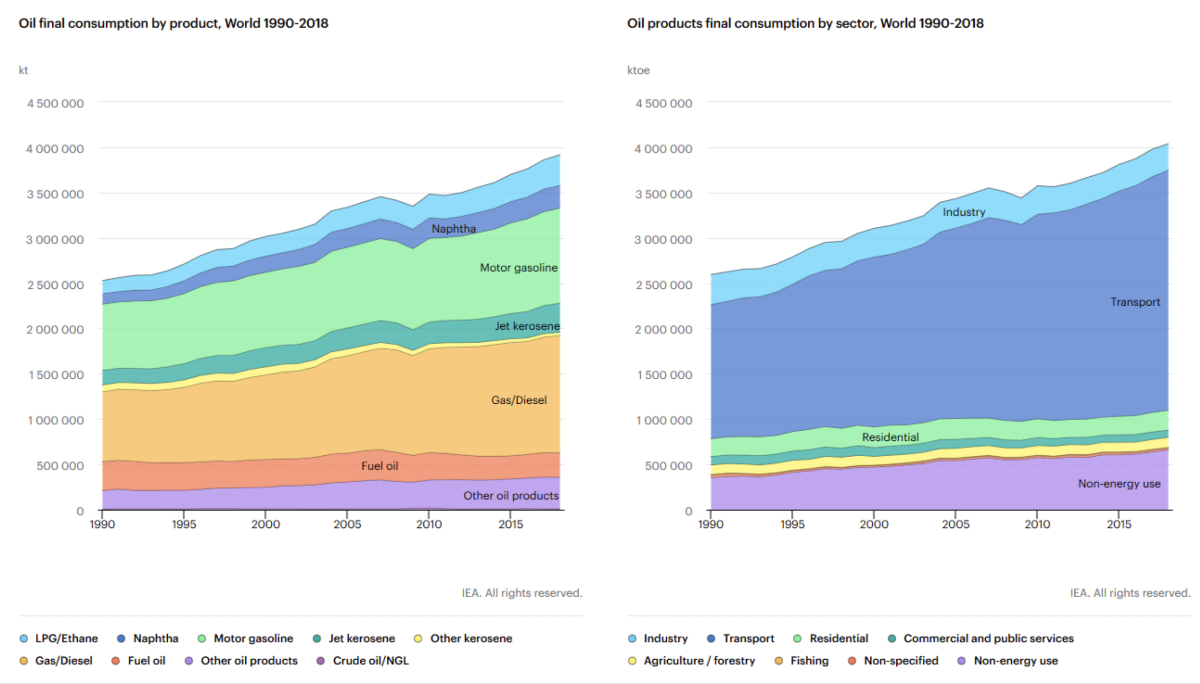
Consistency of uses
Medias
Extraction of abiotic resources
Reserves
Definitions
Metals focus
Concentrations
Mineralogical wall
Oil focus
Assessing reserves
Caution in interpretation
Impacts of extractive activities
Growing interdependancies
Energy footprint of minerals
Material footprint of energy
Environmental focus
Other abiotic resources: water & air quality
Biotic resources: wildlife and land
Socio-economical focus
Contrasted local realities
Global frictions…
Rootedin historical inequalities
Reserves
Définition :
Adaptated from [3]
[3] BIHOUIX, P., GUILLEBON, B. ,2010. Quel futur pour les métaux?
[11] USGS, 2014. Estimate of Undiscovered Copper Resources of the World[online]. Fact Sheet.
[12] USGS, 2020. Mineral Commodity Summaries[online].
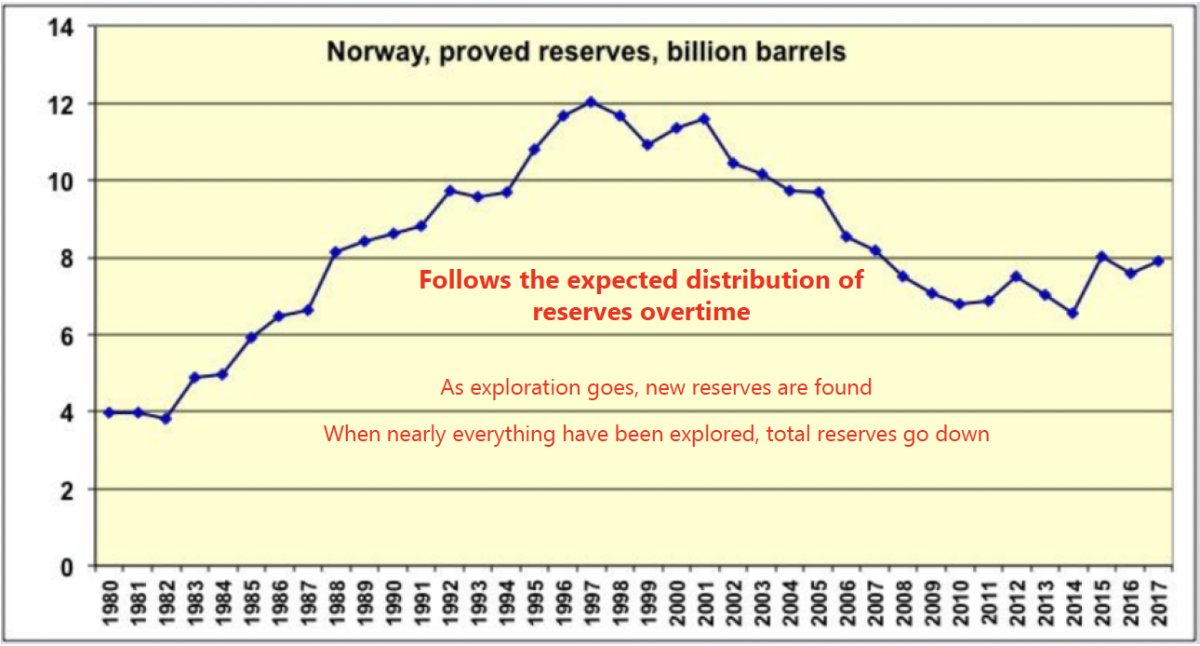
Reserves/Resources data are highly dynamic
May be reduced as
ore is mined
feasibility of extraction diminishes
May increase as
additionnal deposits are discovered
currently exploited deposits are thoroughly explored
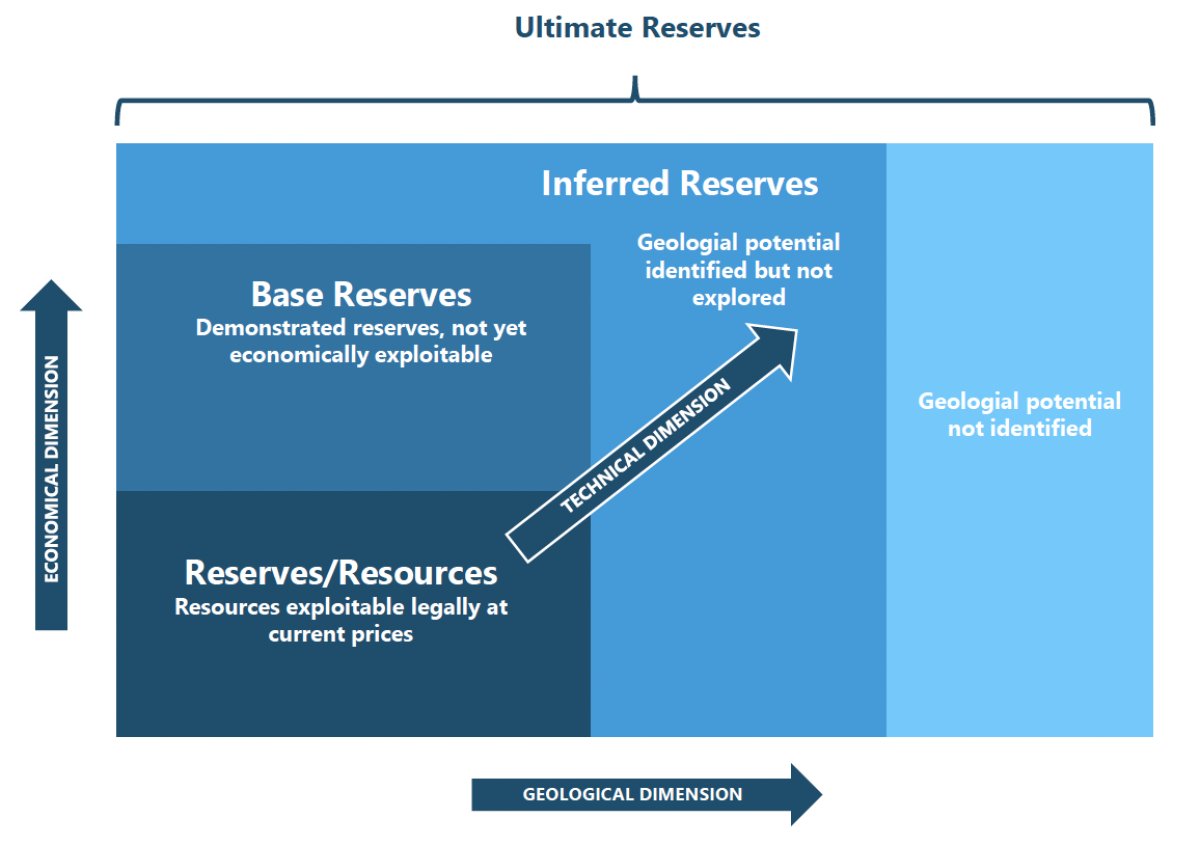
The Copper example : [11] & [12]
Reserves/Resources≃500 Mt (2014) -> 870 Mt (2020)
InferredReserves≃2.1 Bt(2014)
UltimateReserves≃3.5 Bt(2014)
Metals focus
[3] BIHOUIX, P., GUILLEBON, B. ,2010. Quel futur pour les métaux?
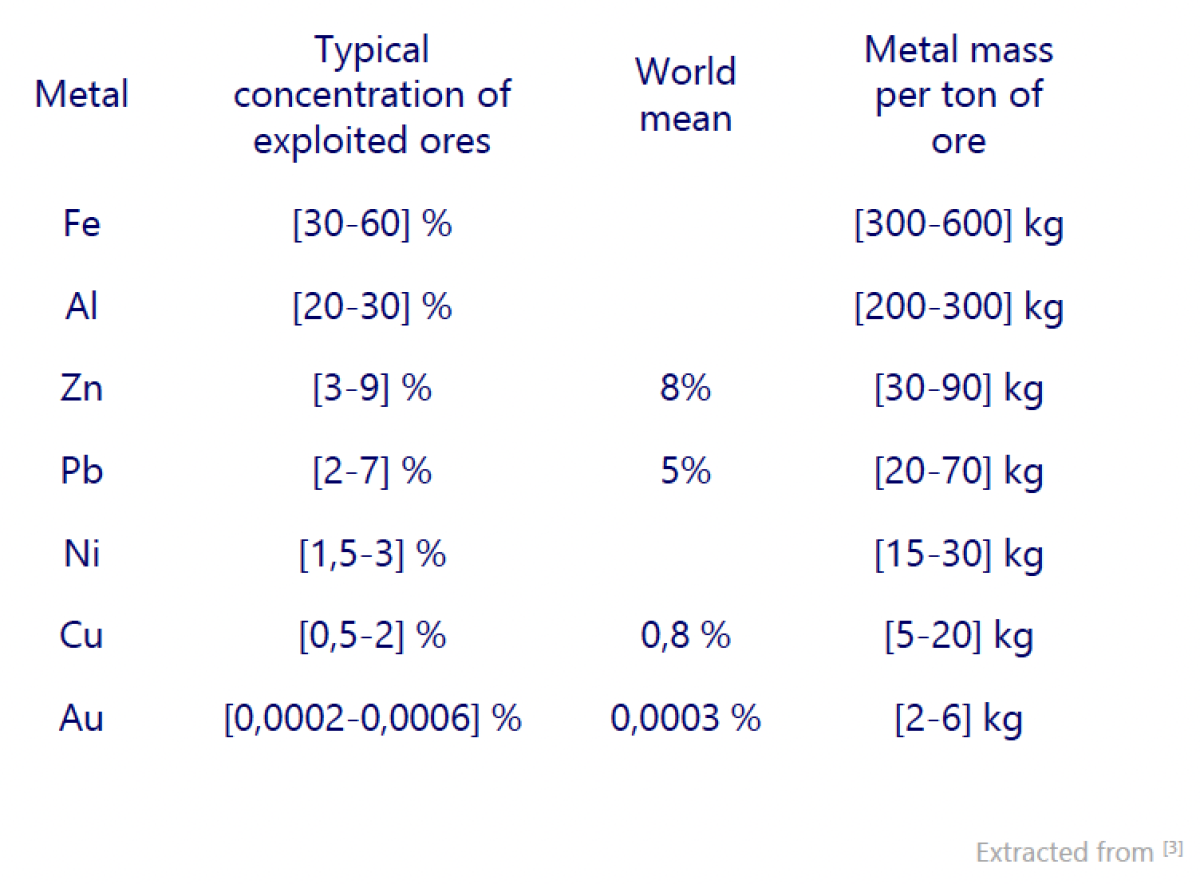
Concentration of minerals
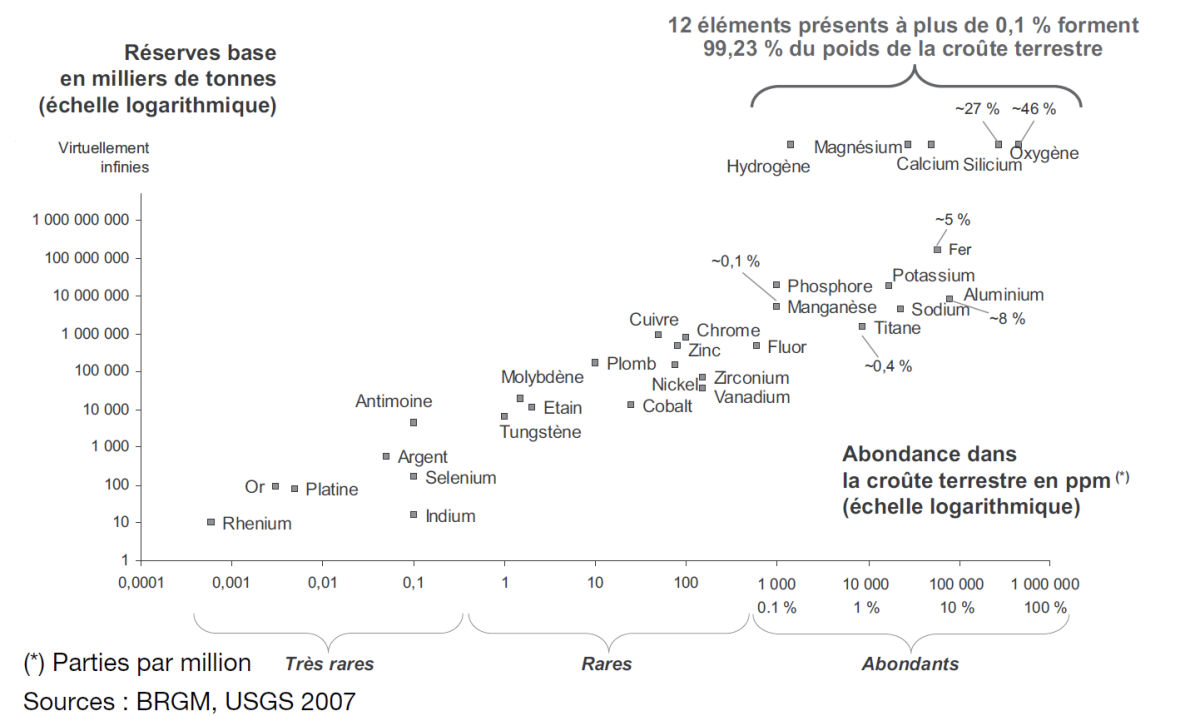
Extracted from [3]
Average concentrations of minerals in Earth crust must be compared to typical concentrations in exploited ores
Even for abondant elements, high ratio between economically viable concentrations and Earth crust average
Iron(Fe) example: 30-60 % in ores versus 5 % average in Earth crust
Precious metals are logically the only ones where the order of magnitude is equivalent
Typical example: Gold (Au)
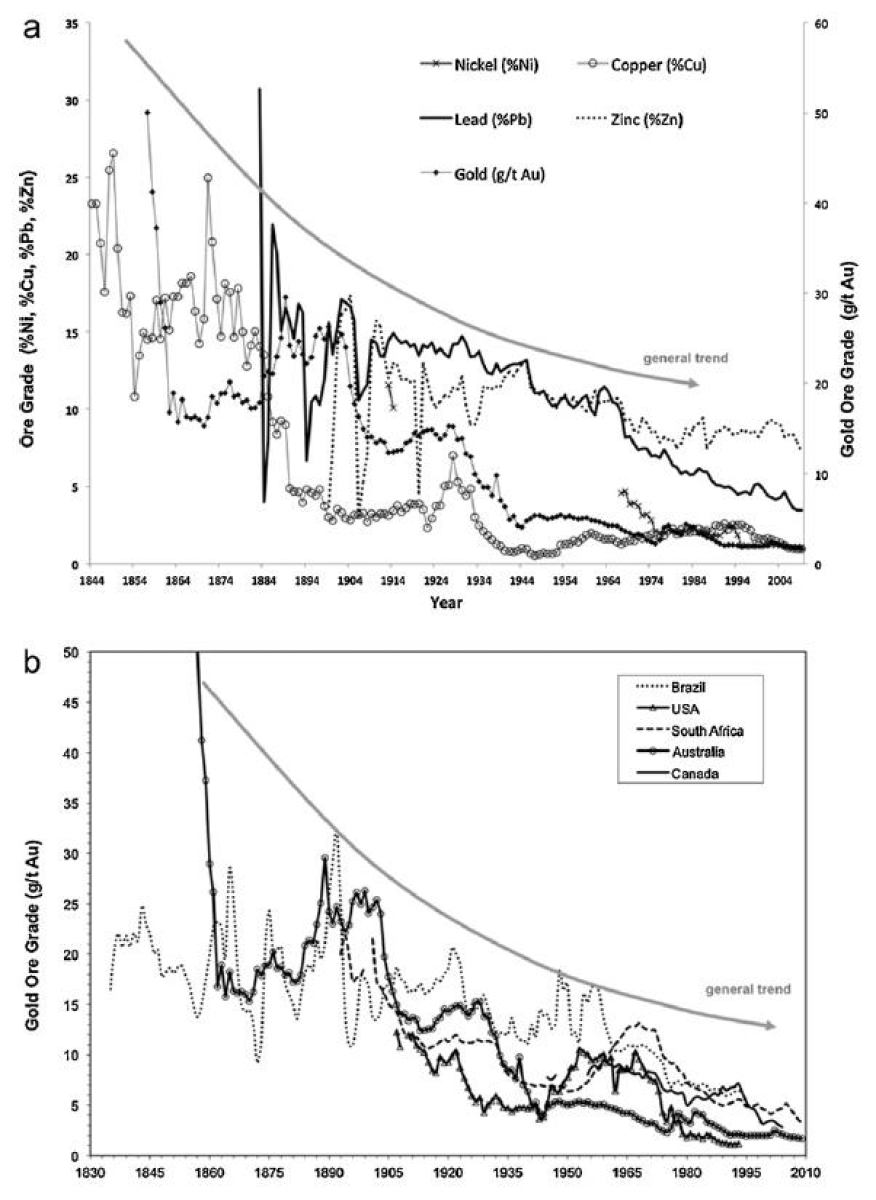
If no major discoveries, historical tendancy is a decrease in average concentration causing an increase in cost and impacts :
Example of Copper (Cu): 1,8% (1930) -> 0,8% 2010
See opposite: (a) Concentration of varied ores in Australia(b) Concentration of Golde ores in the world
Extracted from [24]
[24] PRIOR, T et al., 2012. Resource depletion, peak minerals and the implications for sustainable resource management.
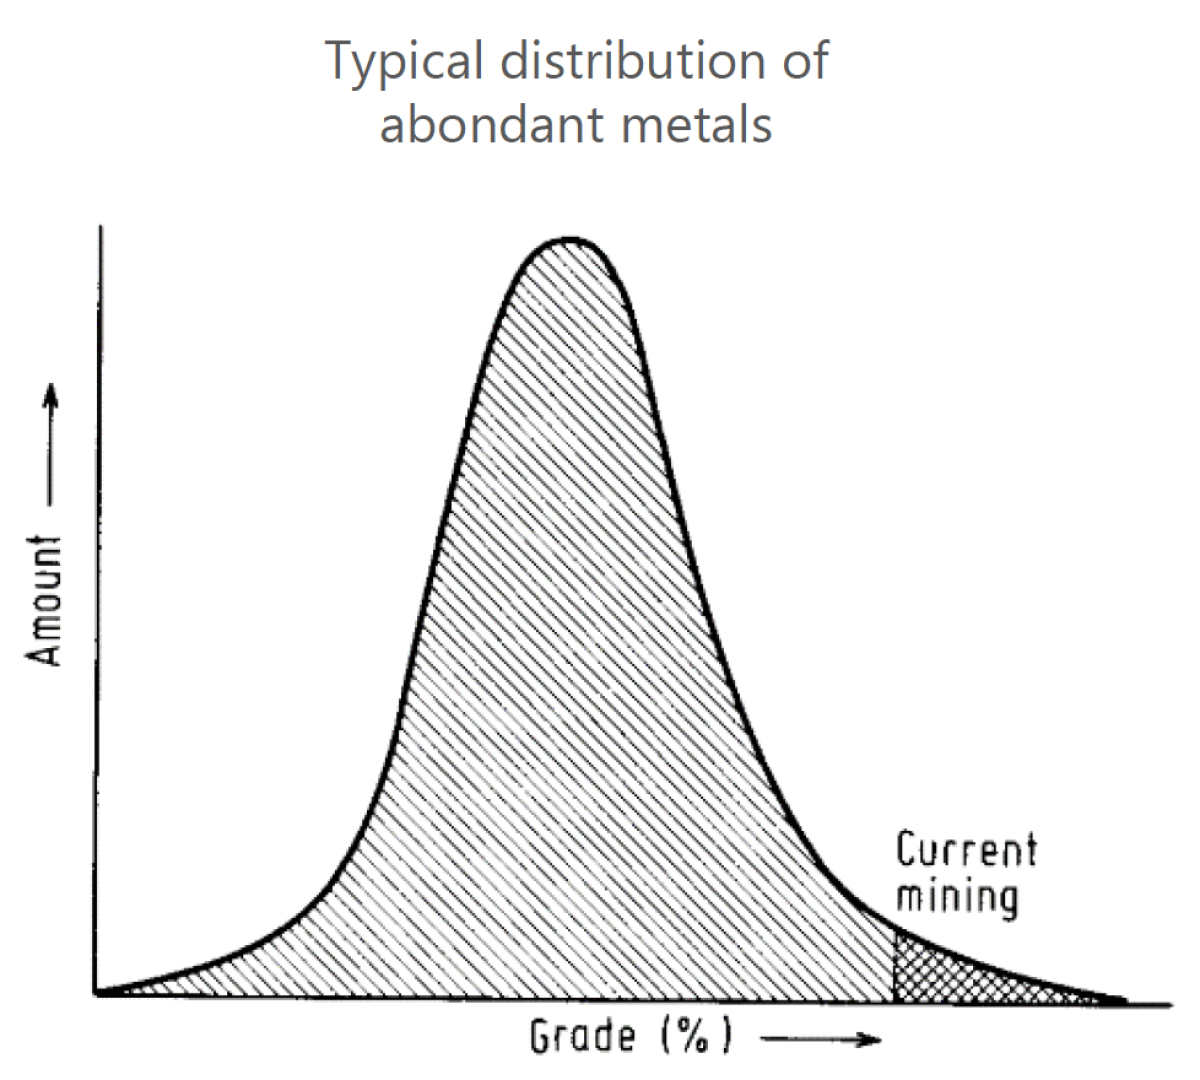
B. Mineralogical barrier
Abondant metals mining follows a simple curve :
Highest-grade ores are mined first, as they’re the most available ones–technically and economically
Like for any finite resources, mining depletes stocks, then target less high-grade ores, until a production peak happen, after what availability diminishes
Extracted from [13]
Scarce metals are usually not found in common rocks as separate minerals but as atoms substitutions (that’s makes them rare)
Consequently, mining activities directly seek concentrated ores (geologically rarer themselves), then must rely on more common ores, following a bimodal mining curve
Extracted from [13]
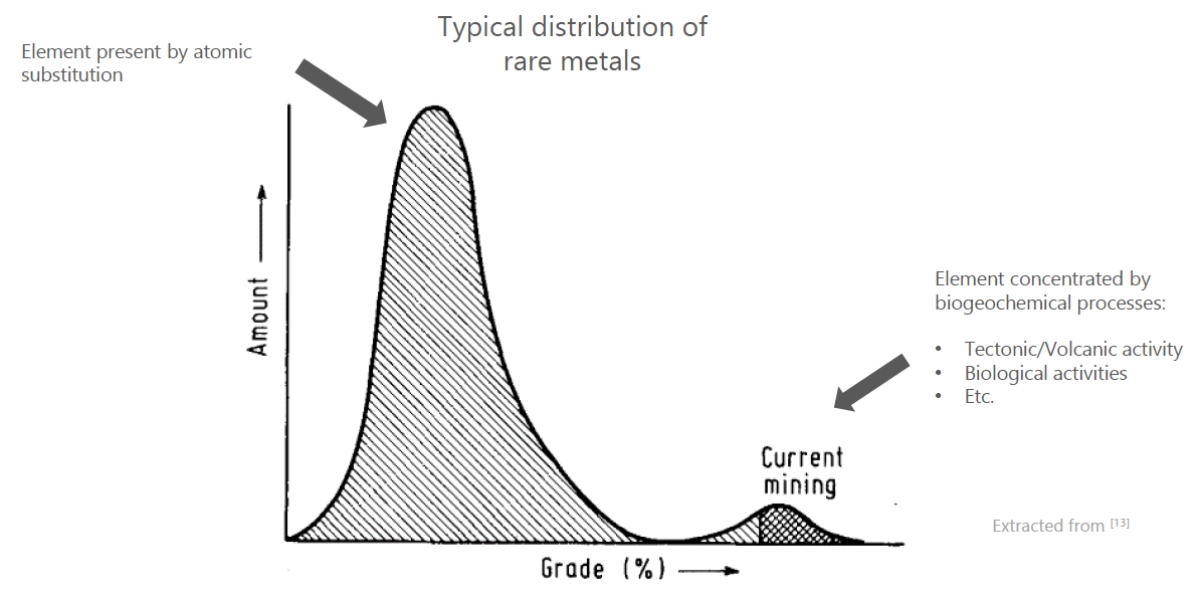
The shift to these more common rocks can be a turning point in processes needed, and generate a mineralogical barrier
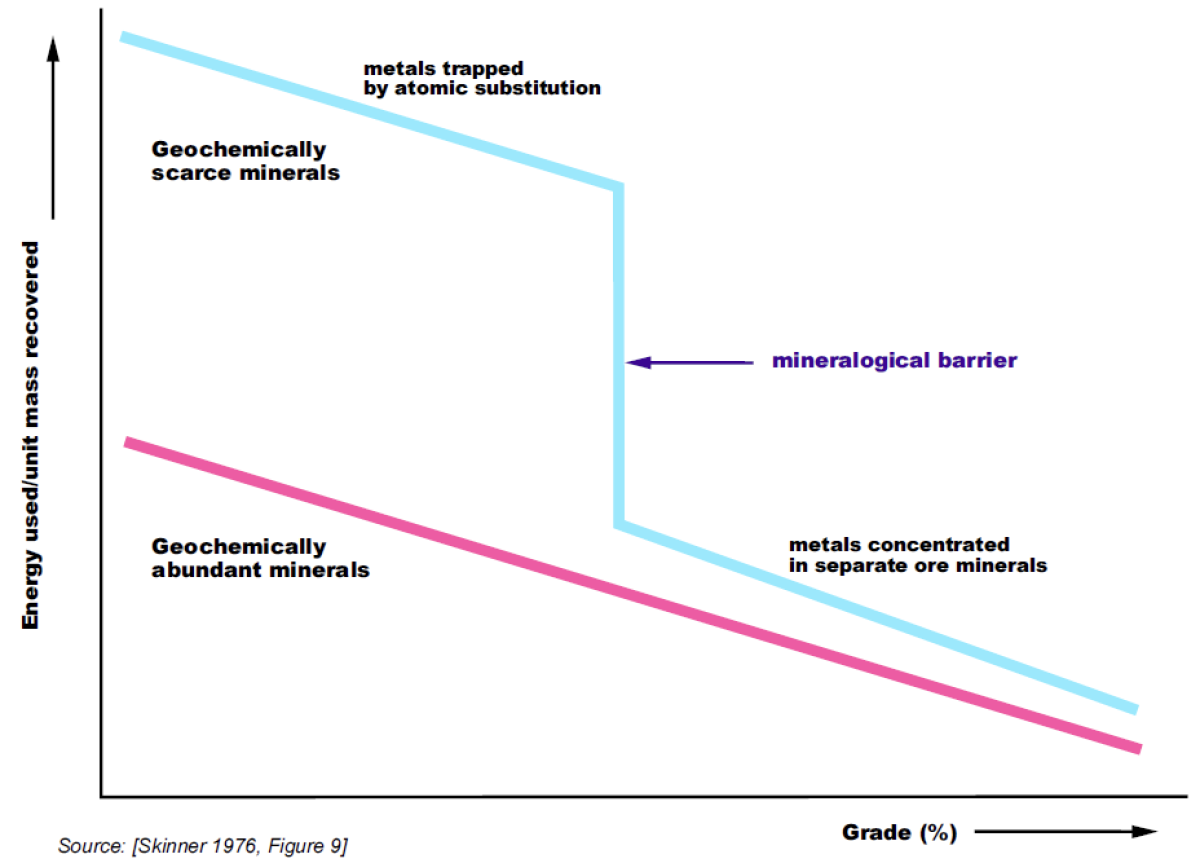
[13] SKINNER, B.J., 1979. Chapter 10 A Second Iron Age Ahead? In: Studies in Environmental Science. [14] AYRES, Robert U, 2001. Resources, Scarcity, Growth and the Environment. . 2001. P.35.
Oil focus
Assessing reserves [15]
Extracted from [6]
[6] BP, 2020. BP Statistical Review of World Energy. [online].
[15] JANCOVICI, Jean-Marc, 2019. Les Energies fossiles. Ecole des Mines [online].
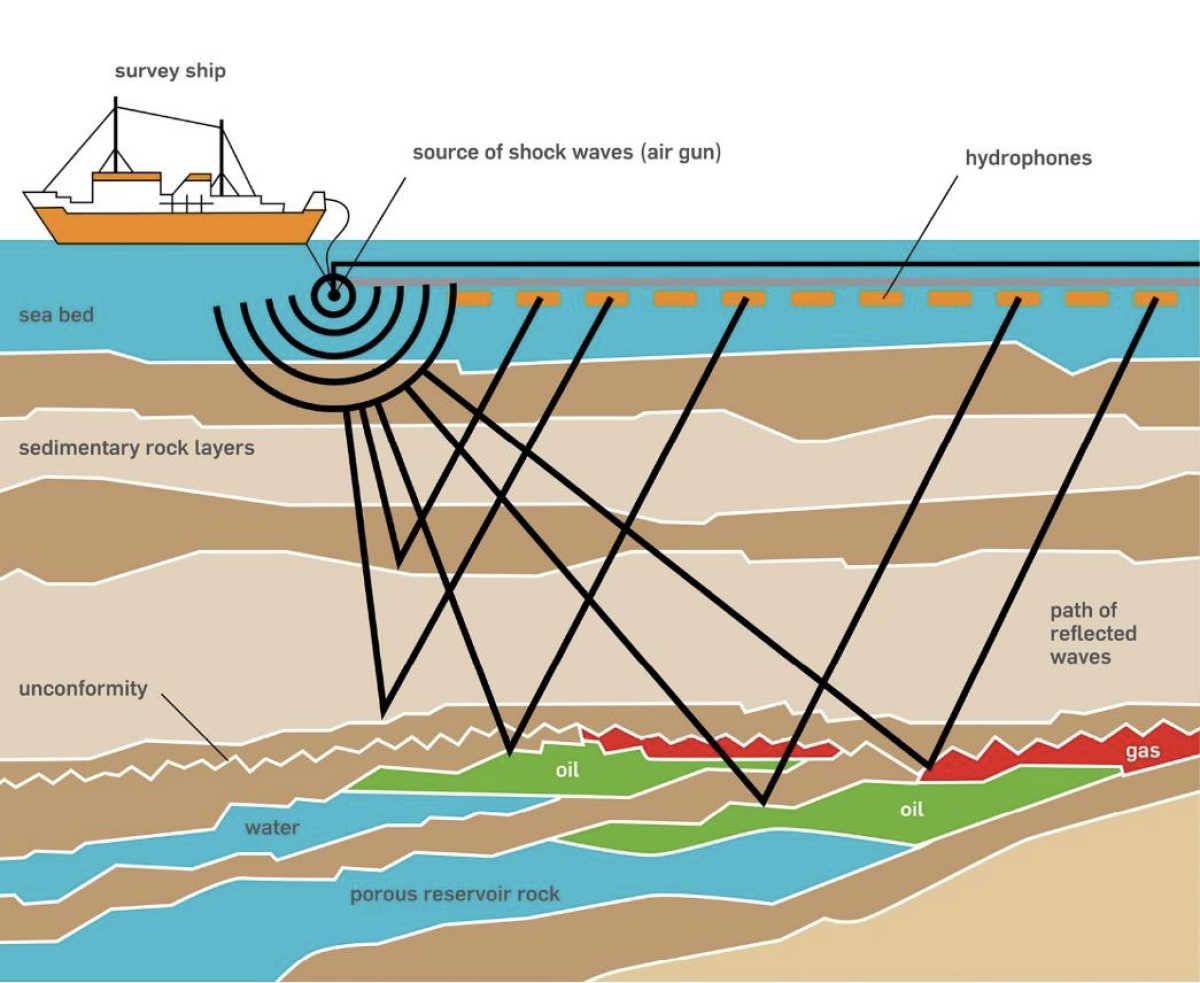
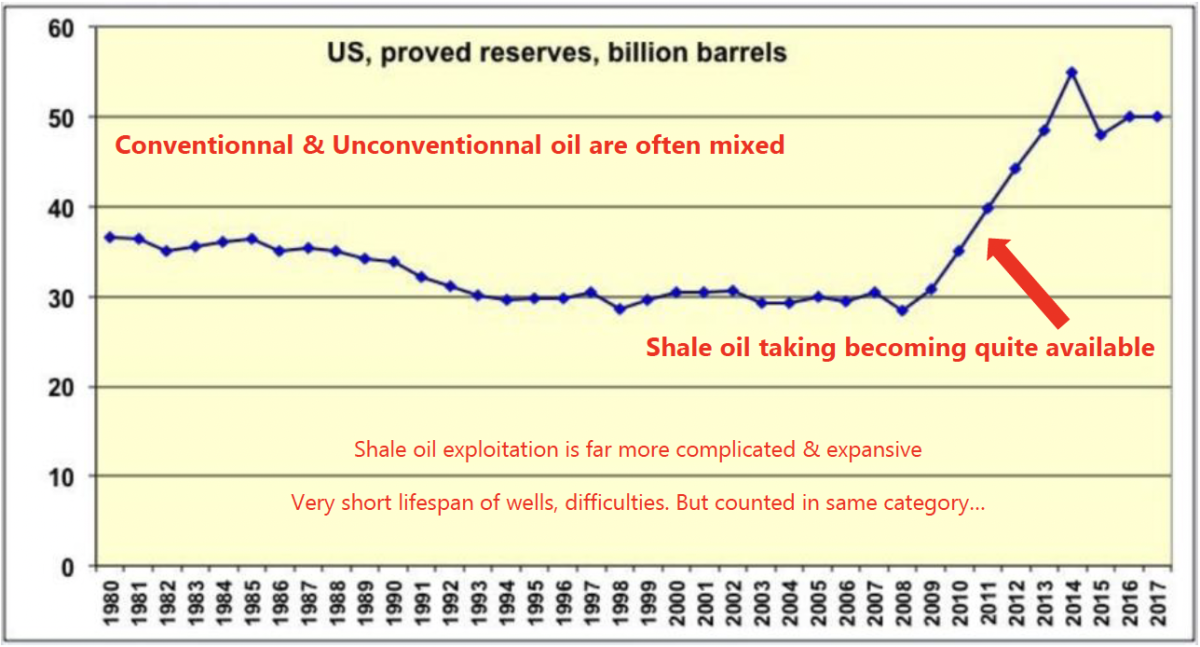
When a potential reserve of oil is suspected, sismography combined with exploratory drilling is used to estimate :
Quantities of oil
Probable recovery rate of the oil
As any oil extraction needs heavy infrastructure -> CAPEX>>OPEX.
Which means the dynamics of a specific reserve are :
Strongly dependent on quantities& recovery rates estimations accuracy
Weakly dependent of variations in oil price(infrastructure already there)
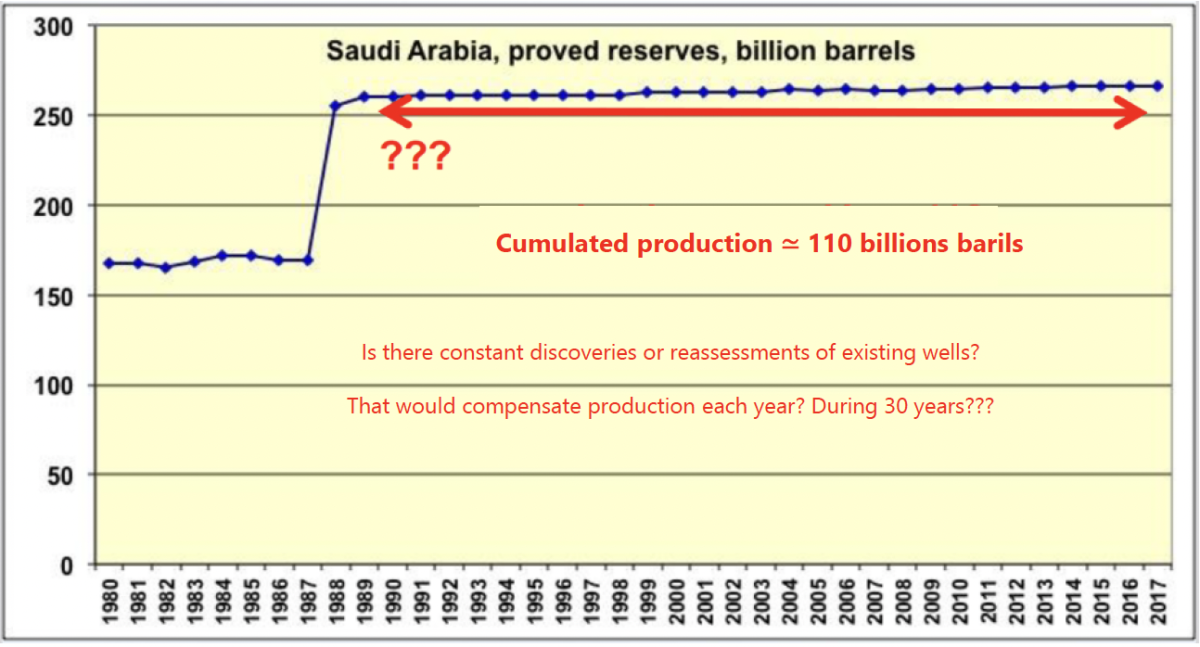
Who evaluate & declare the reserves?
A lot of oil companies are state-owned. Around 10% of oil compagnies are listed on the stock exchange -> legally binded to communicate the estimations
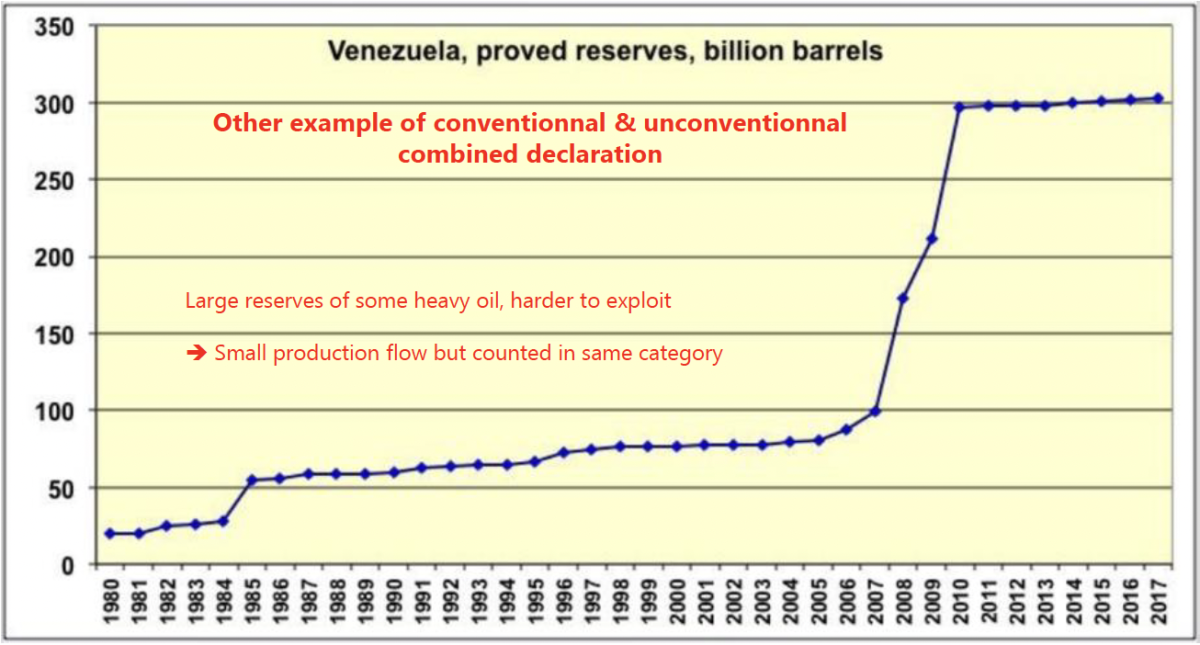
Large part of data comes from countries but :
Geopolitical strategies due to production international agreements
Different conventions on what to count and in which category
No independent verifications
Caution in interpretation
Adapted from [15]
Medias
Impacts of extractive activities
Growing interdependancies
Energy footprint of minerals
A lot of operations involved
Extraction, mineral processing, metal working
1st order transformation: smelting and refining
Transport between steps
This raw metal undergo varied 2nd order transformations to become raw products with diverging final energetical footprint
Copper example: tubes 20-30% higher footprint than foils
Uncertainties in data
Diversity of production sites (mineral concentration, efficiency of processes)
Varied studies perimeter (no standard approach, weigh of hypothesis)
Disparities in sources of information available
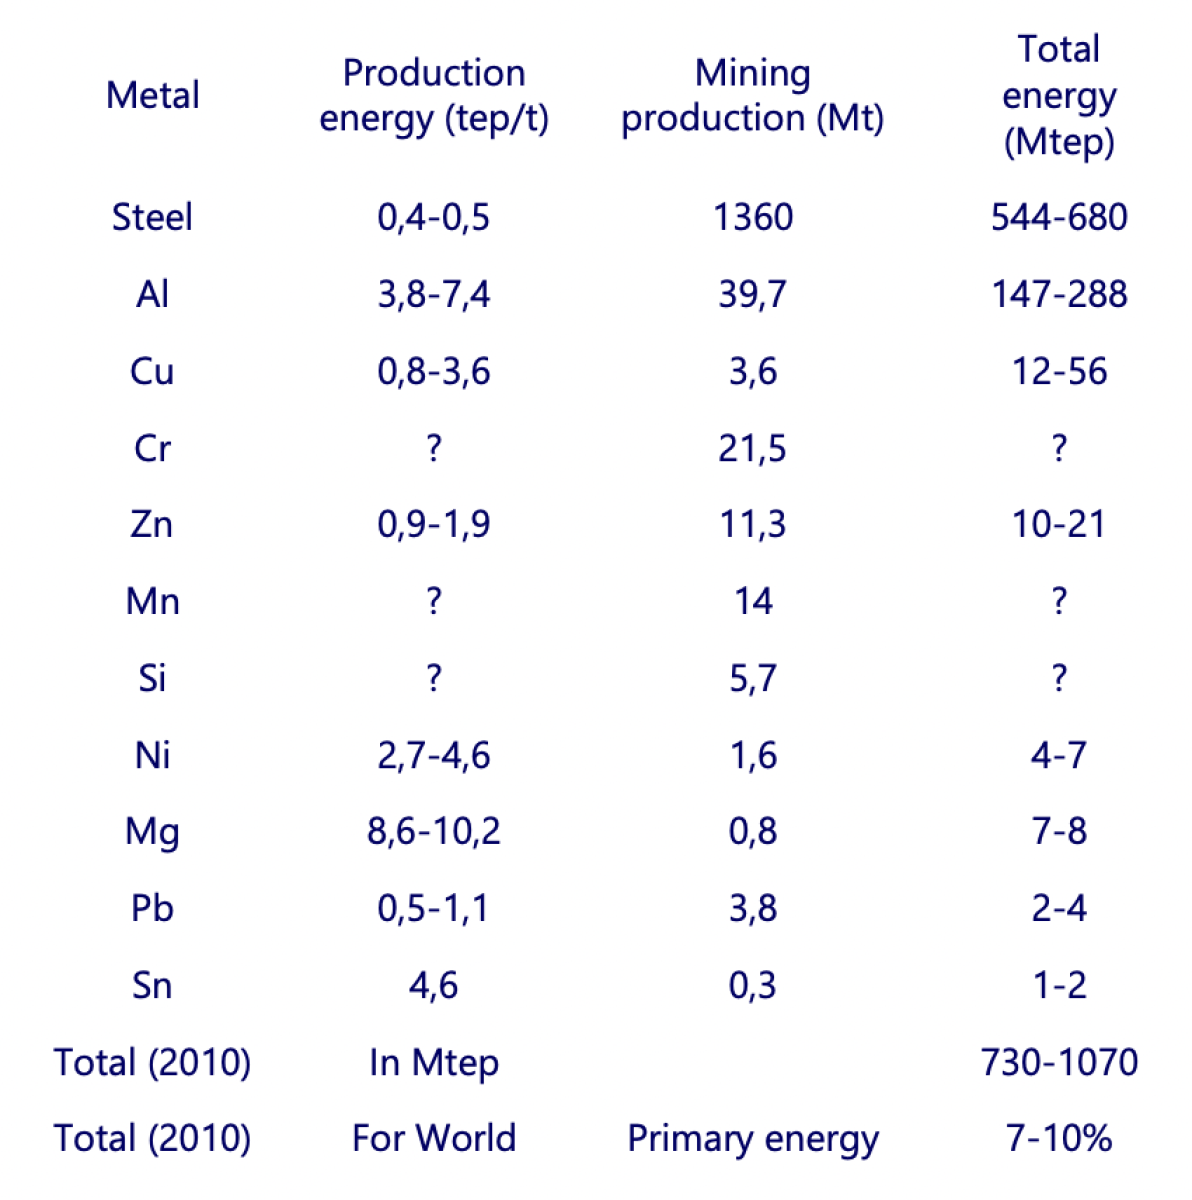
Extracted from [3]
Extraction & Refining of metals
Less & less concentrated mineral resources -> more & more energy
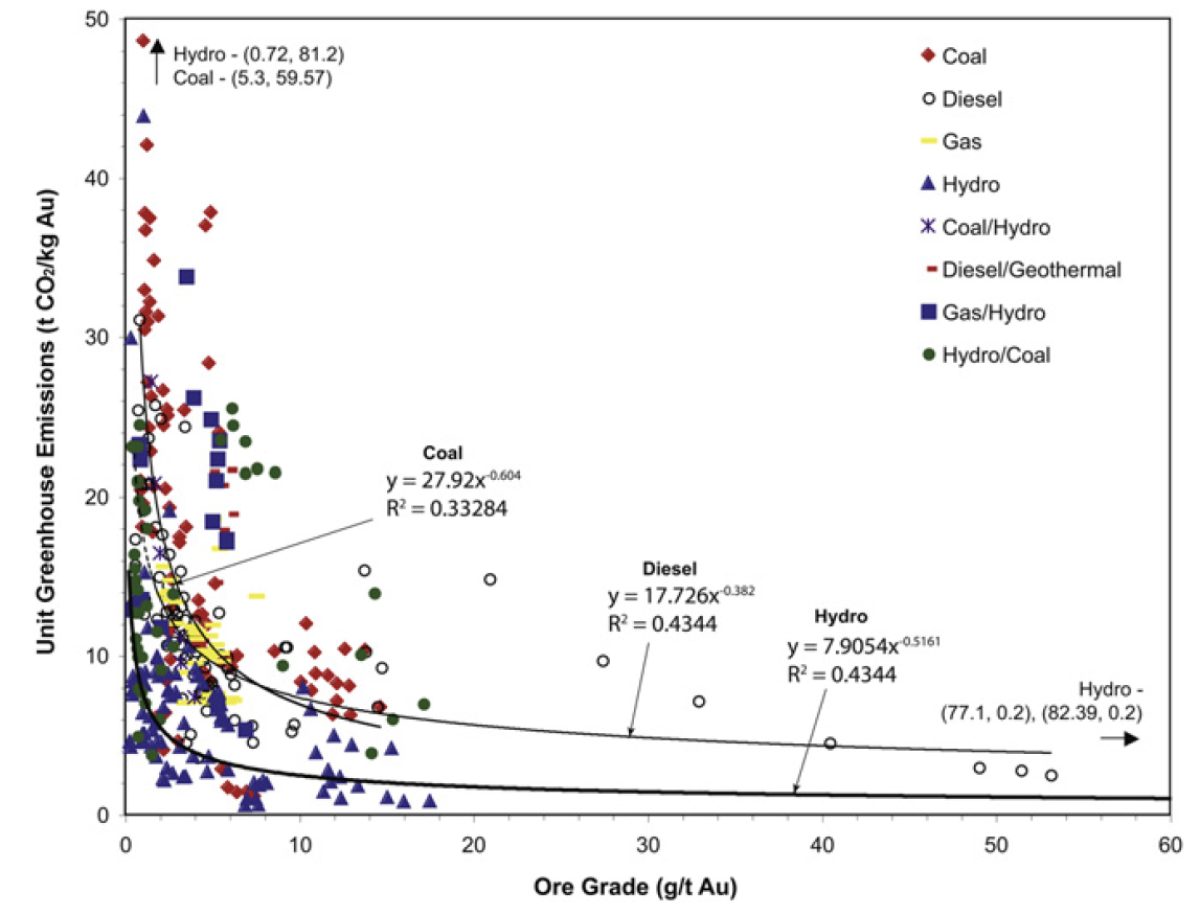
Extracted from [24]
[24] PRIOR, T et al., 2012. Resource depletion, peak minerals and the implications for sustainable resource management.
Material footprint of energy
Extraction & Refining of oil
≃5% of world Steel use for gas/oil exploration & production
‘Offshore’, ‘Depp offshore’, or
Unconventionnal oil -> rise in the use of platforms, ships, complex tools, etc.
Even « Renewable energies » are quite materially dependent:
A 1MW windmill contains ≃ 3t of Cu, and needs 10x more steel & concrete per kWh than a classical plant
A classical PV installation (Si) needs ≃ 4kg of Cu per kW capacity.
Most these technologies also need rare metals like In, Ga, Se, Ne, etc.
Environmental focus
Other abiotic resources: water & air quality
Impacts on abiotic resources: water & air quality [16] & [17]
[16] ELAW, 2010. 1st Edition: Guide pour l’évaluationde EIE de projetsminiers [online].
[17] Hydraulic Fracturing 101. Earthworks [online].
[3] BIHOUIX, P., GUILLEBON, B. ,2010. Quel futur pour les métaux?
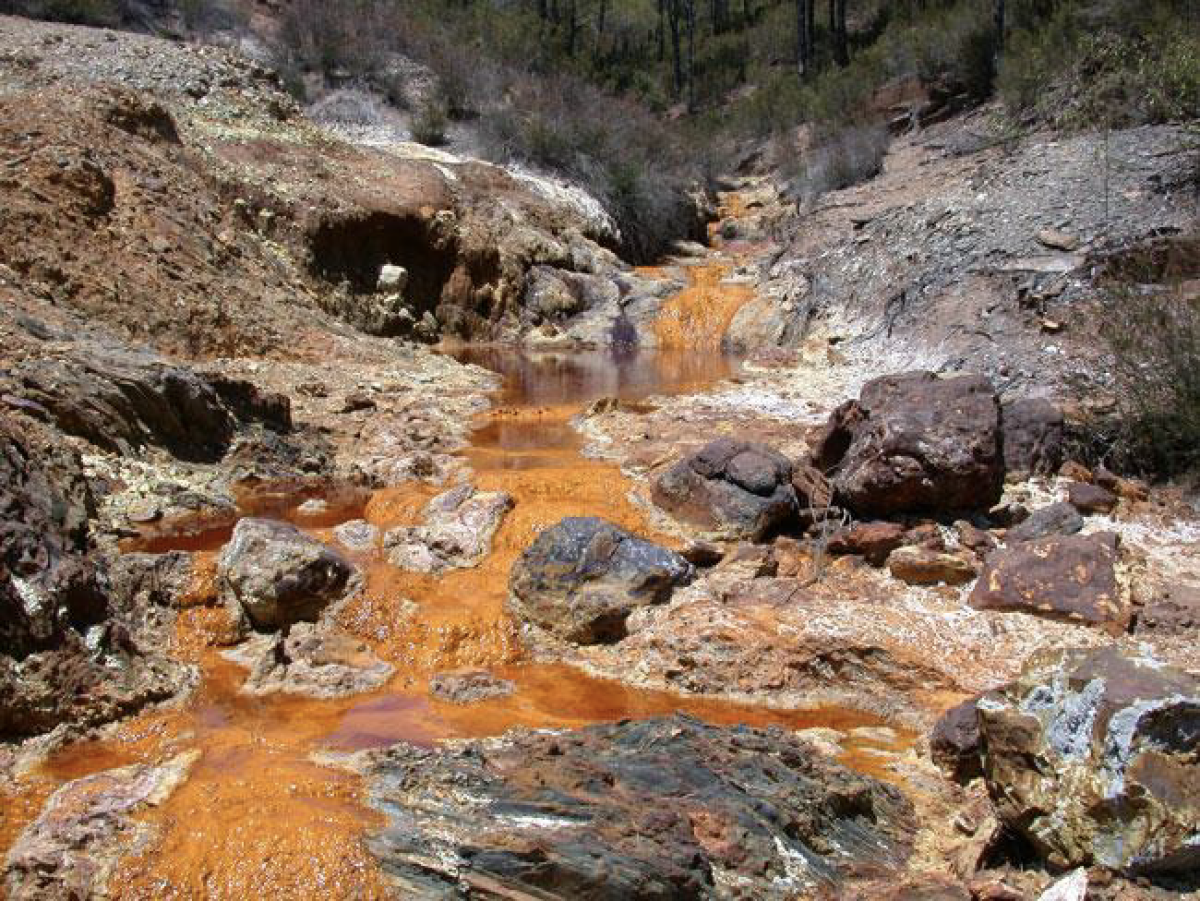
Acid drainage :
Most ores contains sulfure -> exposition to the surface through mining -> formation of sulfuric acid -> dissolves other metals and spills out in surrounding rivers or groundwater Ex: Summitville (1992-1995) [3]
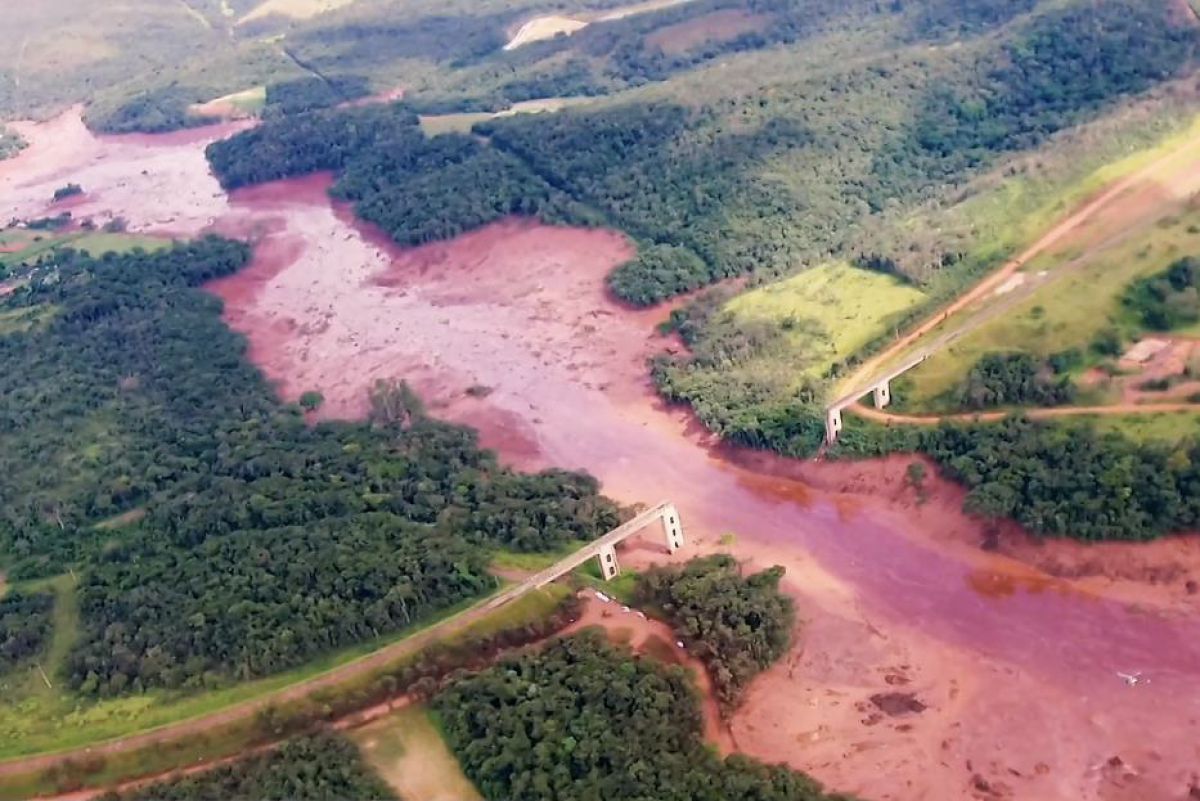
Settling tanks
Containment of mining wastes -> infiltration into ground water or over flowsi n case of rain(one of the worst possible industrial accidents in terms of environmental impact) Ex: Aznacollar 1998 in Spain
Mines dewatering
Mining sometimes directly meet the groundwater table -> pursuit of mining need pumping of water -> reduction or elimination of water circulation in surrounding zones, varied degradations on soils and wildlife
Ex: Sadiola Gold mine pumped 5,6 Mm3 of water in a year (≃ consommation of 800 000 Malians) [3]
Mobile or non-mobile sources of air pollutants
Fuel combustion & exhaust gases of machines or vehicules -> CO2, CO, organic compounds -> climate change
Waste particles dispersed by wind
Precious metals are often melted onsite before sent to rafineries -> high levels of Hg, As, SO2
Uncontrolled mercury (Hg) rejections
[Hg] in ores can rach 10 mg/kg -> 1 Mt of ores produced means 10t of Hg potentially emitted
Vaporization of Hg in gold metling is a major cause of Hg mission in atmosphere
Specifics to oil :
Hydraulic fracturing & Oil spills contaminations
Details in [17]
Biotic resources: wildlife and land
[16]ELAW, 2010. 1st Edition: Guide pour l’évaluationde EIE de projetsminiers [online].
[17] Hydraulic Fracturing 101. Earthworks [online].
Loss of habitat
Excavation or accumulation of waste -> mobile species (birds and some mammals)are hunted out + sedentary species (little mammals, reptiles, invertebrates) are killed
Acid drainage or dewatering -> severes impacts on surrounding aquatic life
These 2 points -> perturbation of trophic chains (diminution of food for the higher- level predators)
Disparition of vegetation
Fracture of habitat
Large portions of land occupied
-> perturbation of migrations or local isolation of species
Specifics to oil (again):
Hydraulic fracturing & Oil spills contaminations
Details in [17]
Socio-economical focus
[16] ELAW, 2010. 1st Edition: Guide pour l’évaluationde EIE de projetsminiers [online].
[17] Hydraulic Fracturing 101. Earthworks [online].
[3] BIHOUIX, P., GUILLEBON, B. ,2010. Quel futur pour les métaux?
Contrasted local realities
[16] ELAW, 2010. 1st Edition: Guide pour l’évaluation de EIE de projets miniers [online].
[17] Hydraulic Fracturing 101. Earthworks [online].
[3] BIHOUIX, P., GUILLEBON, B. ,2010. Quel futur pour les métaux?
Human migrations
Displacement & reinstallation of communities (expropriated or not) -> resentment + power perturbations -> local conflicts
New high economic activity -> arrival of new populations -> new pressures on land, water or waste management -> tensions & potential conflicts with original inhabitants
Ex of Grasberg Mines in Indonesia: From <1000 (1973) to 110 000 (1999) ; violent conflicts during 1970-1990
New needs of infrastructures -> urbanization -> wide-ranging effects
Loss of drinkable water access
Due to uncontrolled exploitations & industrial pollutions
Pressures on means of existence
Mining activities not correctly managed -> economic cost on other sectors (agriculture & fishing in particular)
Public health consequences
Potential sanitary risks are often seglected
-> example of improvised mining towns are been shown to threaten food security and availability
Indirect effects of exposition to mining activities are higher incidences of tuberculosis, asthma, chronic bronchitis, etc.
A review of metals direct toxicity impacts can be found in a dedicated chapter of [3]
Cultural & Esthetics
Destruction of cultural resource by surface perturbation or excavation
To pographical or hydrological changes
Higher access to previously inacessible locations
-> theft or vandalism of cultural artifacts
Visual impacts due to deforestation& presence of infrastructures
Global frictions...
[25] HUISMAN, J., PAVEL, C., et al. 2020. Critical Raw Materials in Technologies and Sectors -Foresight [online].
[3]BIHOUIX, P., GUILLEBON, B. ,2010. Quel futur pour les métaux?
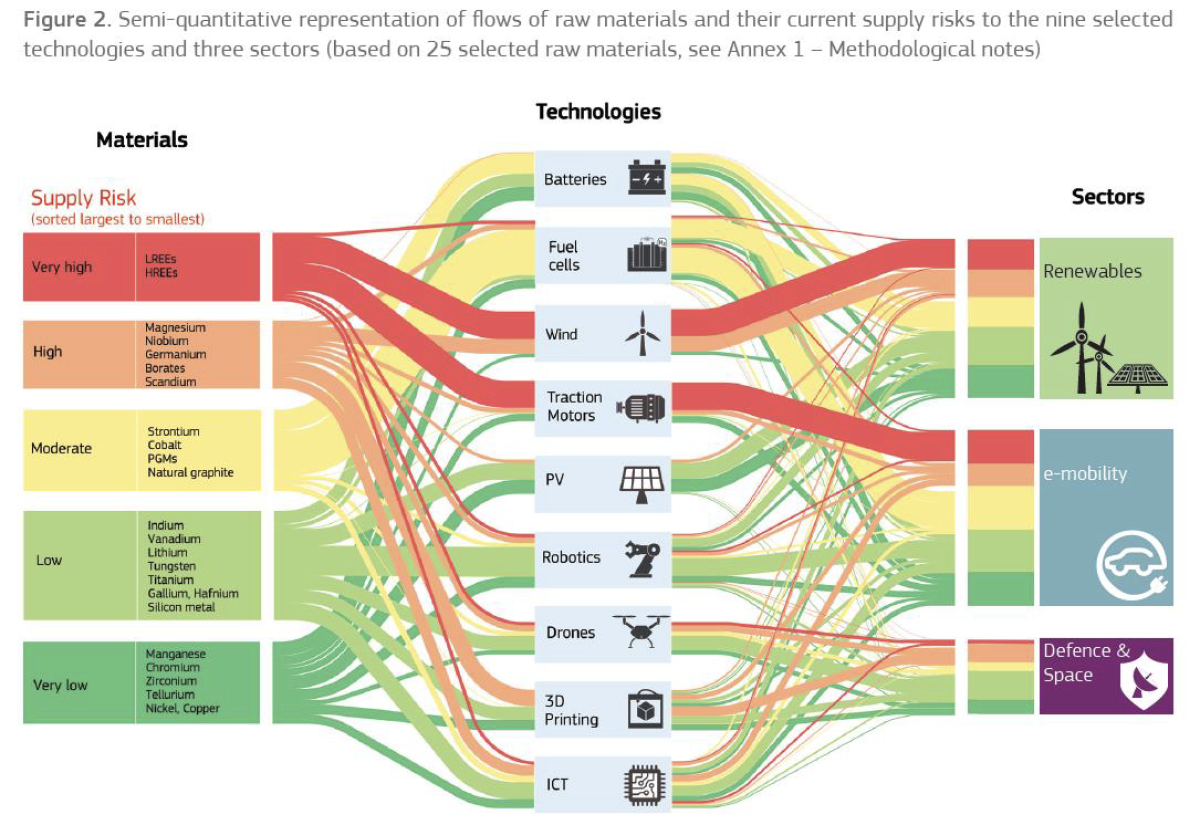
Emerging geopolitical stakes for metals
As for oil, the main consumer countries are also the ones with the smallest reserves
Understanding of these problematics is more recent for metals and is parallel to the recent rise of metals prices in the 2000s
The EU Commission now regurlaly pubish reports on the matter[25]
Strategical stocks of metals constituted during Cold War, dismantled after the 90s, are back since15-20 years
Capitalistic concentration of compagnies :
in 2008, 4173 compagnies in mining but 149 majors (3,6%) were controlling 83% of the market[3]
Power to initiate struggles with states over natural resources and their exploitation, in order to maximize private profits and mutualize losses or environmental externalities
Complex conflicts with explicit and implicit actors
[3] BIHOUIX, P., GUILLEBON, B. ,2010. Quel futur pour les métaux?
Armed conflicts already existing
Not as visible as oil conflicts yet
DRC (Democratic Republic of the Congo) being the richer african country in metals, its history since mid-XXth is a paradigmatic example
Crossings with colonization & neocolonization
1961 Defense agreements between France, Niger, Dahomey & Ivory Coast garantee limitation of exportations to other countries than France in case of needs
2007 contract of China & RDC: heavy construction work (6 billions $) in in exchange of metal mining authorizations (10 Mt of Cu, 200 000 t of Co, 372 t of Au)
With explicit intention of asking land if the metal provisionning does not meet expectations
Direct implication in local economy
No need to developp on the well known history of oil geopolitical conflicts since mid-XXth!
Rooted in historical inequalities
[3] BIHOUIX, P., GUILLEBON, B. ,2010. Quel futur pour les métaux?
[18] RITCHIE, Hannah and ROSER, Max, 2017. CO₂ and Greenhouse Gas Emissions. Our World in Data[online].
[19] BONNEUIL, C., FRESSOZ, J-B., 2016. L’événement anthropocène: la Terre, l’histoire et nous.
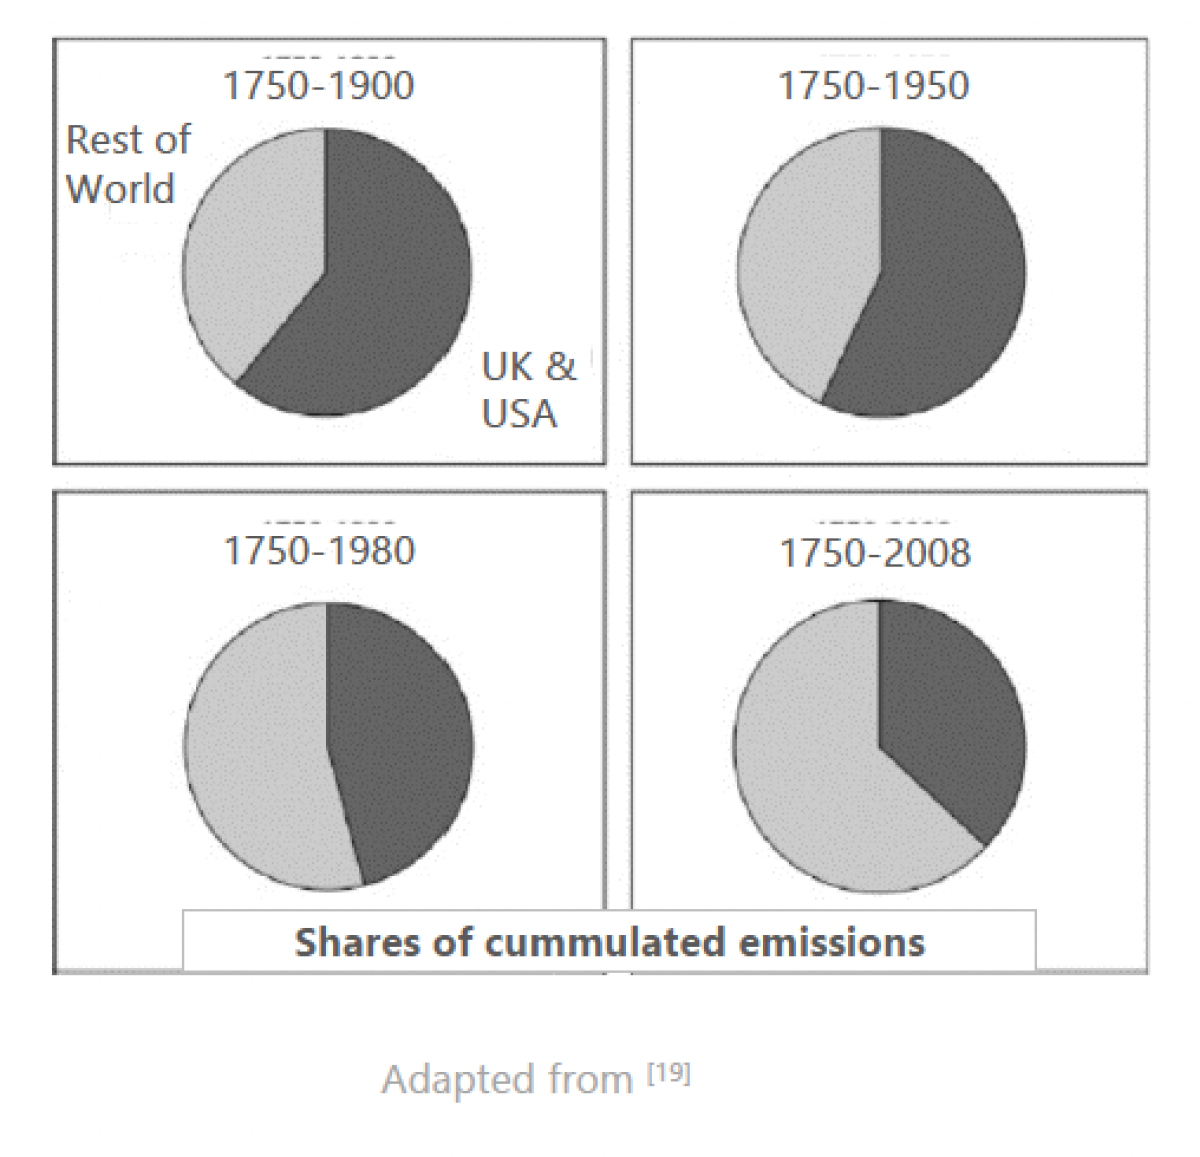
Developed countries did develop themselves on the exploitation of countries now productors & consumers
Between 1815-1880, 5/6 of British investments were outside their empire, chiefly to develop mining (coal, in particular) and transport of ores by rail in dominated countries [19]
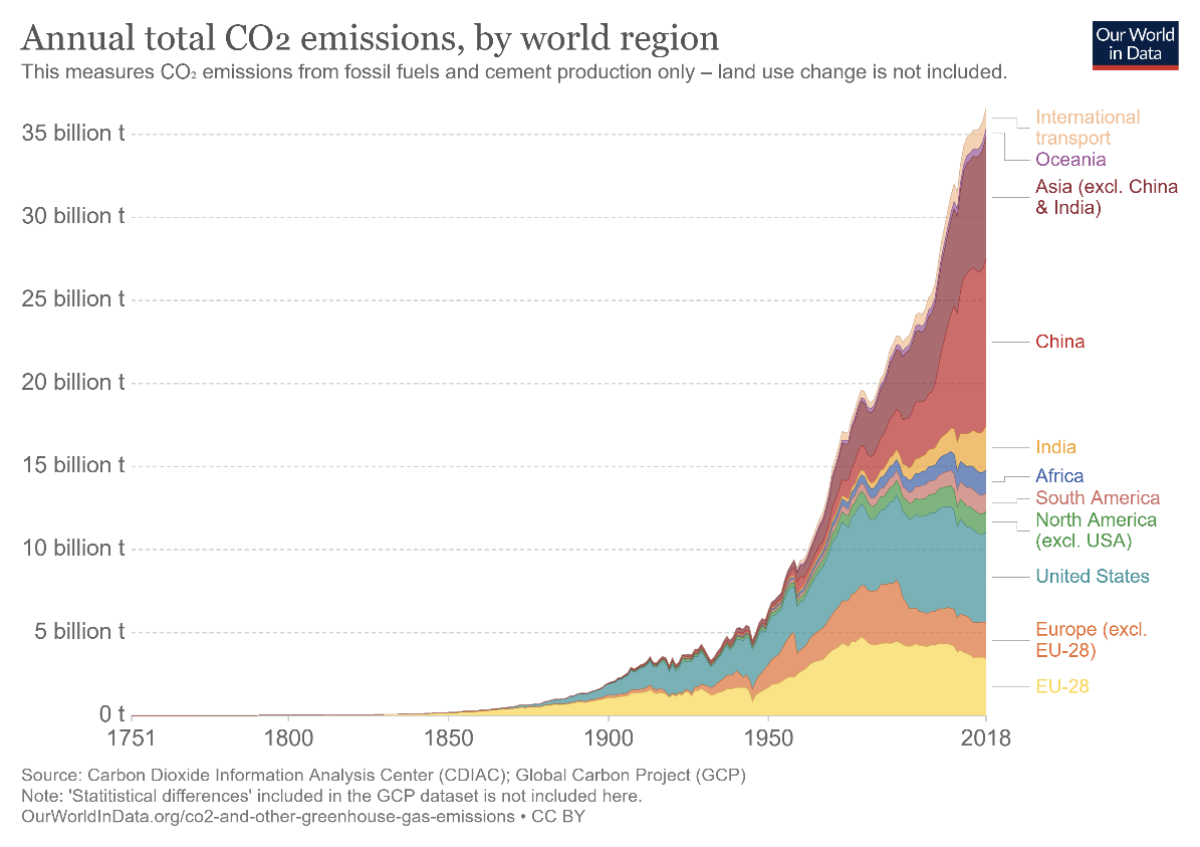
20th century have mainly reorganized exploitation, but it continued on
USA based its economic rise on intensive use of its own resources during 1870-1940
Supported decolonization mainly to gain access to material resources of newly independant countries
Conversely, East block exploited its own environnment above all
Emerging trend ->
Reappropriations of national resources & path of developpmen
Setting of export restrictions [3]
Medias
Perspectives of abiotic resources
A matter of Stocks
The stocks’s stakes
Climate change – CO2 eq « stock »
[6] BP, 2020. BP Statistical Review of World Energy. [online].
[20] EIA, U.S. Energy Information Administration, 2016. Carbon Dioxide Emissions Coefficients. [online].
[21] IPCC. 2018. Mitigation Pathways Compatible with 1.5°C in the Context of Sustainable Development. . P. 82.
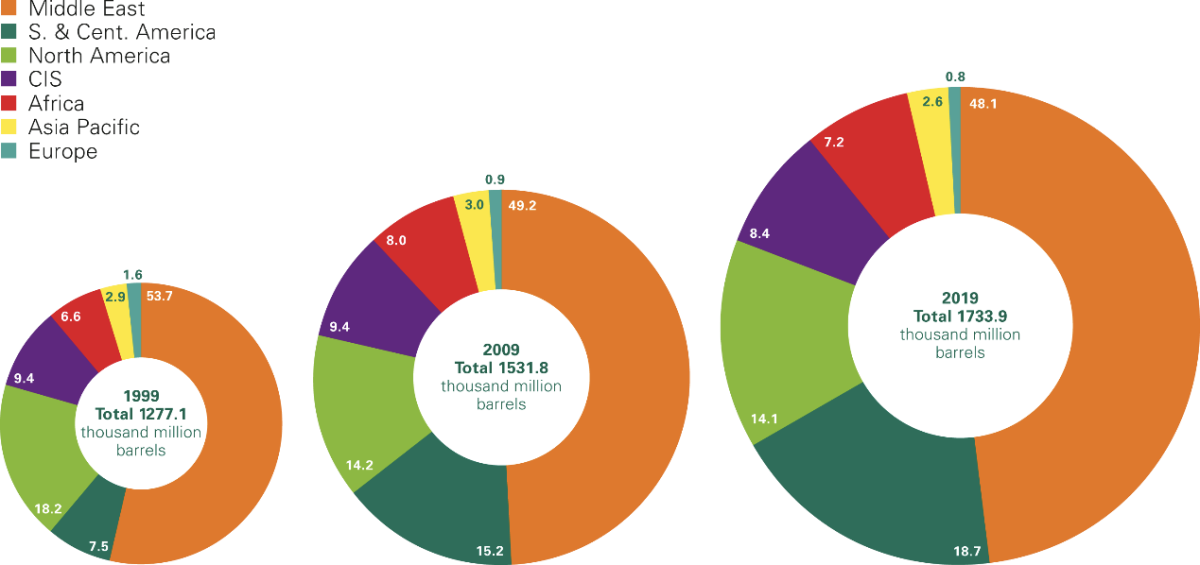
Oil emissions of current reserves
Proven reserves :
-> 1733,9 billions barrels [6]
53750,9 billion gallonsAverage on varied oil uses gives ≃ 10 kg CO2 emitted per gallon [20]
-> 537,5 Gt CO2
World CO2 eq budget, current estimations : [21]
1170 Gt CO2 eq to stay <2°C of global warming
420 Gt CO2 eq to stay <1,5°C of global warming
Consomption of all current proven oil reserves is half of our total 2°C world budget and more than our total 1,5°C budget!
Without even considering natural gas, coal, or other emissions (CH4, for example) contributing to radiative forcing...
This considered, without changes, the 2°C threshold should be crossed in about 26 years
[3] BIHOUIX, P., GUILLEBON, B. ,2010. Quel futur pour les métaux?
[10] Data & Statistics,. IEA[online]. Available from : https://www.iea.org/data-and-statistics
And mining is very dependent of highly carbonated, non renewable energy vectors

Adapted from [3] .The values for World averages of Electricity origin were replaced by updated data rom [10]
Production peak
[6] BP, 2020. BP Statistical Review of World Energy. [online].
[15] JANCOVICI, J-M, 2019. Les Energies fossiles. Ecole des Mines [online].
[22] World Energy Outlook 2018. IEA –International Energy Agency.
Hypothesis: we don’t mind CO2 eq emissions
Either we consider it’s not a problem
Or we think innovation or start-ups will solve that
-> Exhaustion of Reserves through Production will still occur!
R/P ratio: most simplified model
Considering current reserves [6]
And 2019 rate of consomption [6] taken as constant for the years to come (quite unrealistic hypothesis of no flow reduction)
-> No oil remaining in ≃ 50 years
[23] CALVO, G. et al.., 2017. Assessing maximum production peak and resource availability of non-fuel mineral resources.
[15] JANCOVICI, J-M, 2019. Les Energies fossiles. Ecole des Mines [online].
[22] World Energy Outlook 2018. IEA – International Energy Agency.
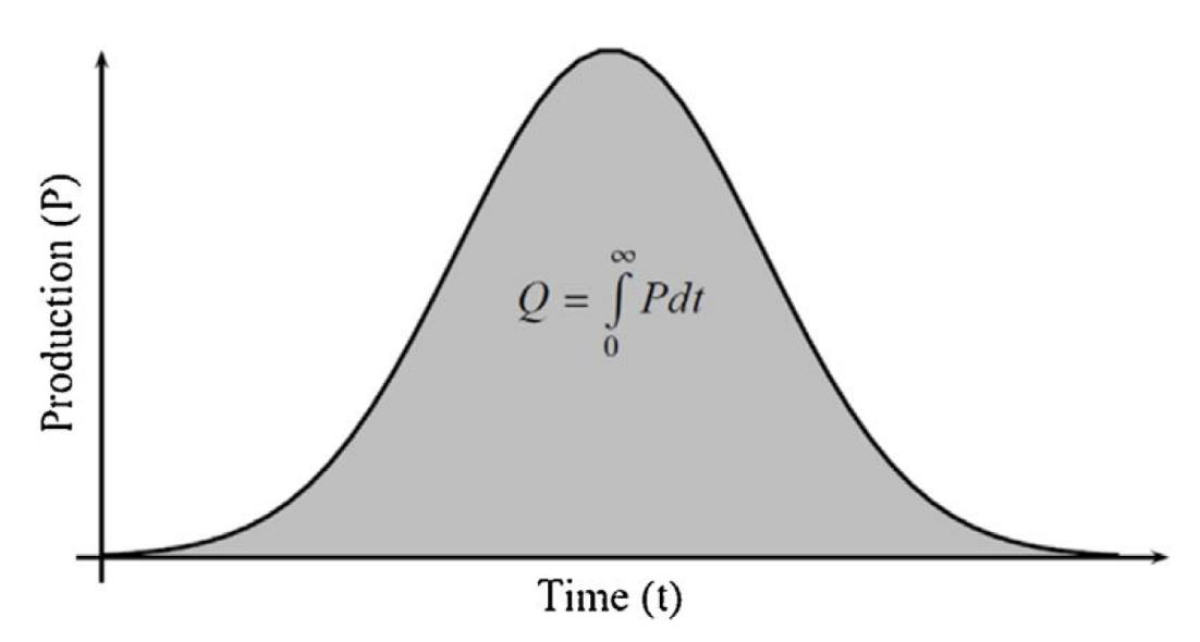
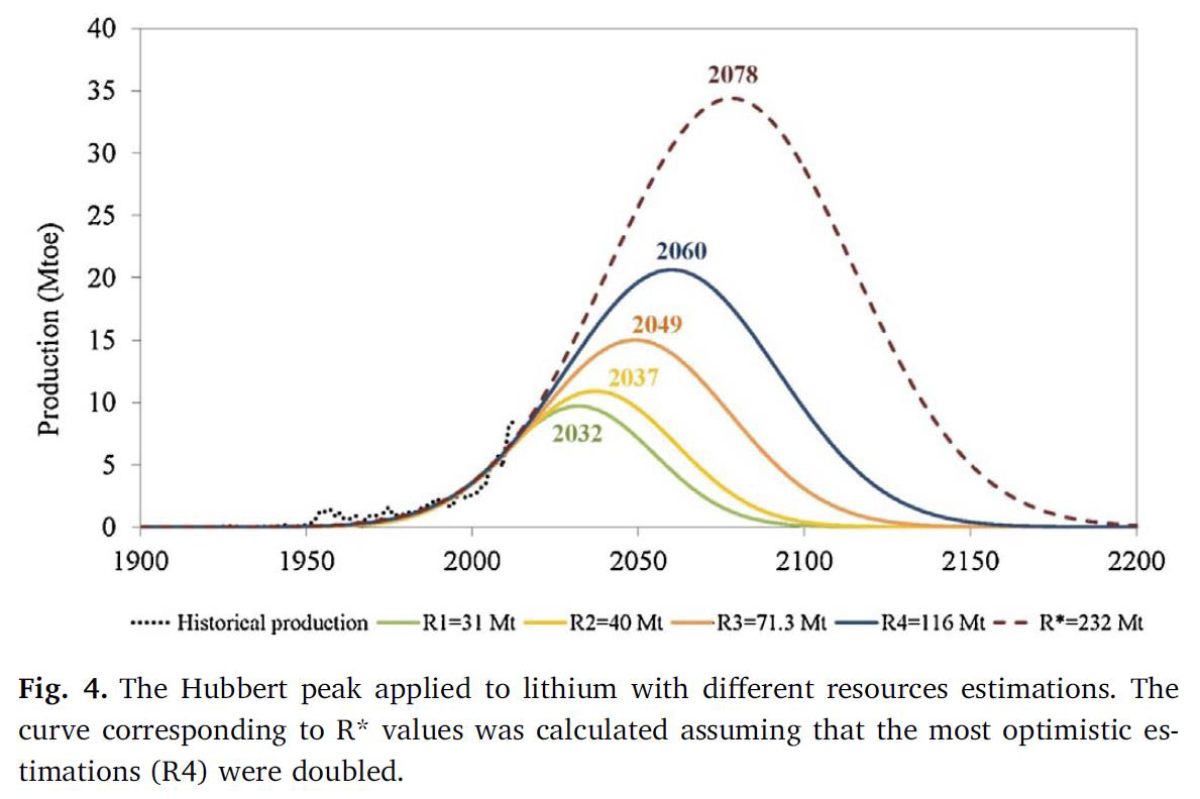
A slightly better estimate: the Hubbert peak model (1956)
We know there is no production at t = 0 and t = t final
The area below the production curve must be equal to the reserve
Regarding conventionnal oil, several countries seems to have peaked already. A review can be found here [15]
It is commonly believed that world production peak of conventionnal oil already happened, in 2008 [22]
Extracted from [23]
Reliability is influenced by several parameters
Uncertainty regarding reserves information
Particular environmental issues: health, water use, ore grade
Sociopolitical issues: new objects, changes of regulation, or armed conflicts
Interdependencies of byproducts
Substitution & recycling
That said, influence of reserves’ variation is limited when rapported to the current trends in production and growth of production
-> Li case study: estimated reserves x 8 only delayed the peak by 46 years
Extracted from [23]
This recent try of systematic assessment is quite interesting to read[23] and accessible!
The time scaling is quite short, even for base metals
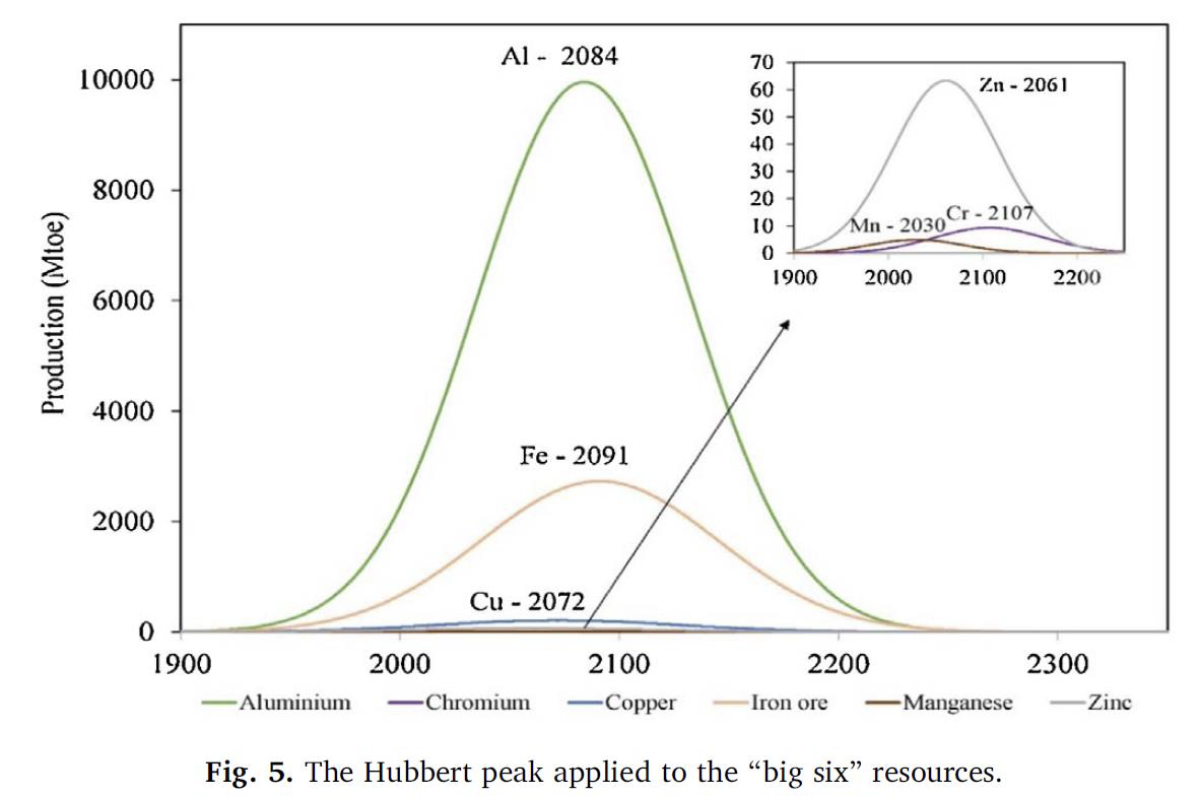
Extracted from [23]
Expected peak in the next 50 years : 12 metals over 47 studied: As, Bi, In, Li, Mn, Mo, Ni, Ag, Ta, Te, Zn
30 metals over 47 have their expected peak in the next 100 years
Gold & Antimony peaked arround 2015 (agreement for Gold with [3])
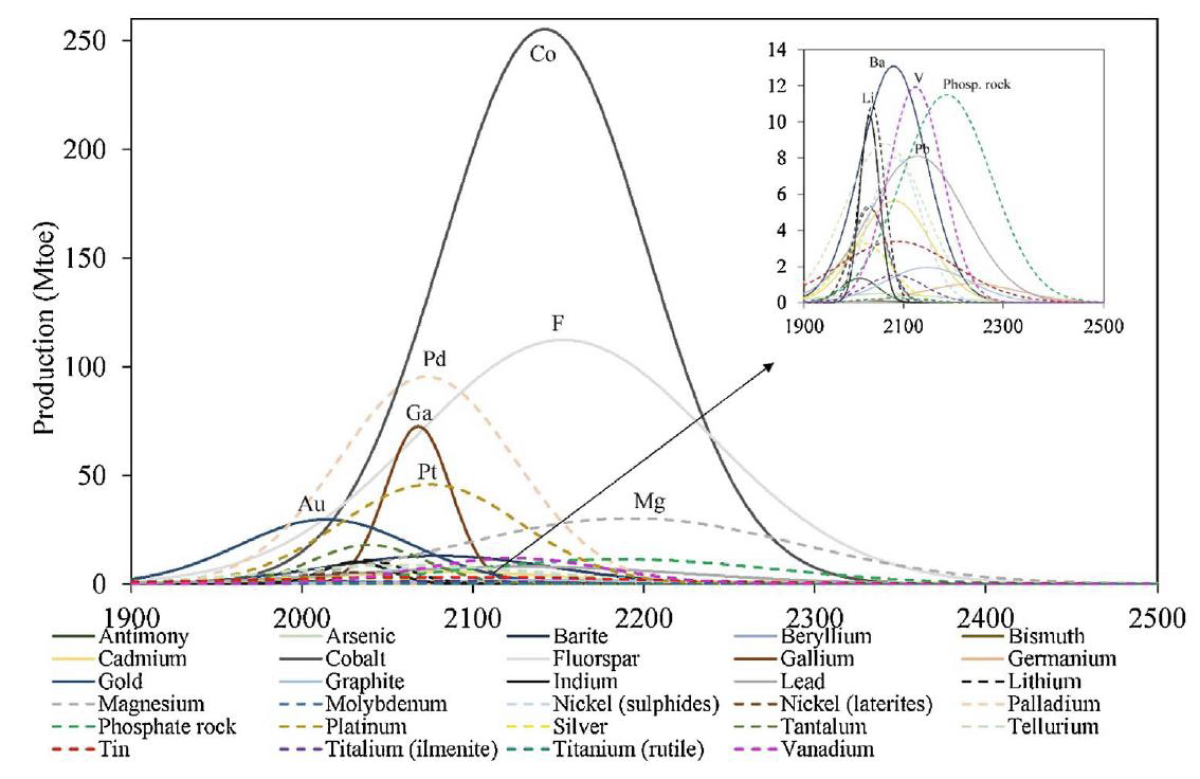
Extracted from [23]
Taking into account the interdependencies of metals
Bold indicates it is the main production process of said metal

Extracted from [3]
[3] BIHOUIX, P., GUILLEBON, B. 2010. Quel futur pour les métaux?
Nearly a half of metals today exploited are interlinked
Extracted from [3]
Criticality
[26] GRAEDEL, T. et al., 2015. Criticality of metals and metalloids. DOI 10.1073/pnas.1500415112.
Notion related to the attempt to assess the relative risks concerning the availability of resources
Relatively recent preoccupation
As availability is an already complex notion, its risk analysis is also complex
Geological abondance & concentrations
Potential for substitution
State of the art of mining technology
Amount of regulatory oversight
Geopolitical initiatives
Governmental instability
Economic policy
As reserves are part of the assessment, it is also dynamic
Several methodologies
At different scales of organizations
For different scales of time
With then varied results difficult to compare between each other
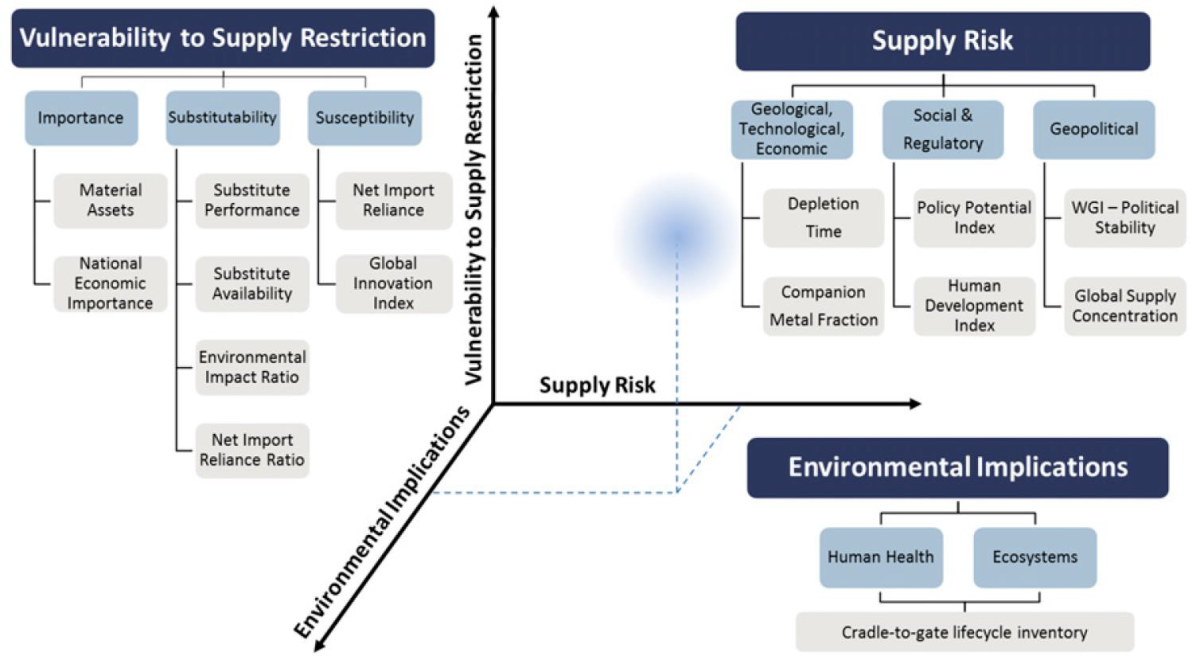
Extracted from [26]
Criticality space: a first step is to get an overall idea
A number of metals are concentrated on the middle: moderately high on at least 2 axis (rare earths, Cr, Te, etc.)
Some are regrouped toward lower left: relatively low criticality (Fe, Mg, Ni, Mn, etc.)
The right side: high supply risk (In, Ag, Tl, As, Sb)
The particular case of Au & Pt
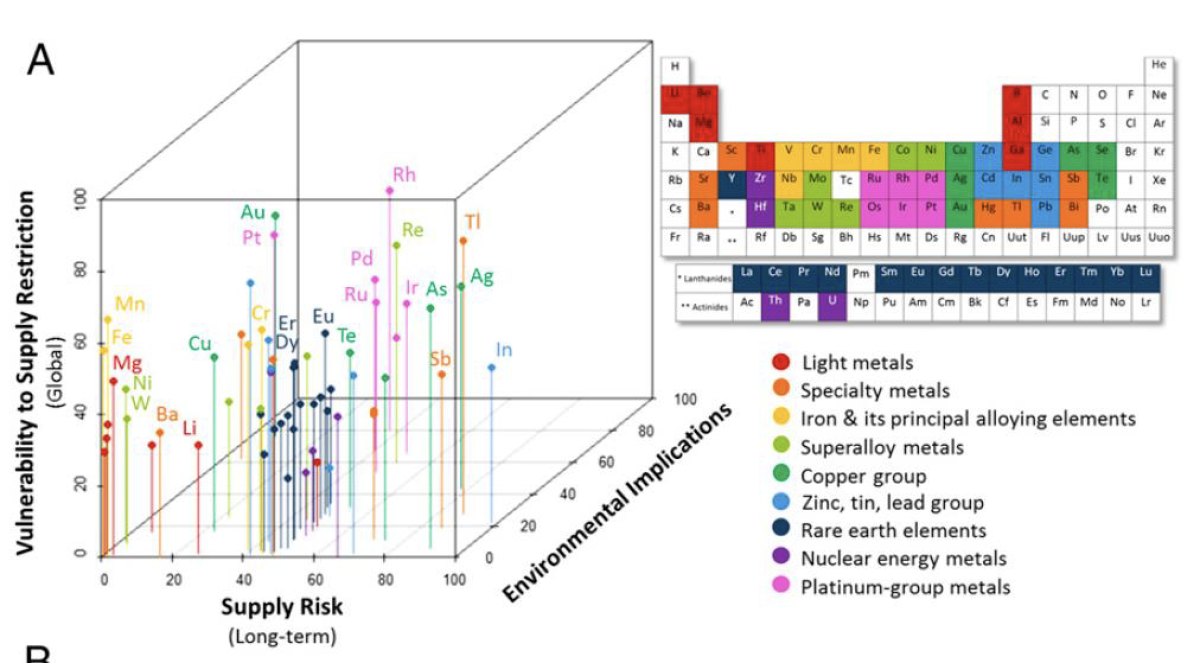
Extracted from [23]
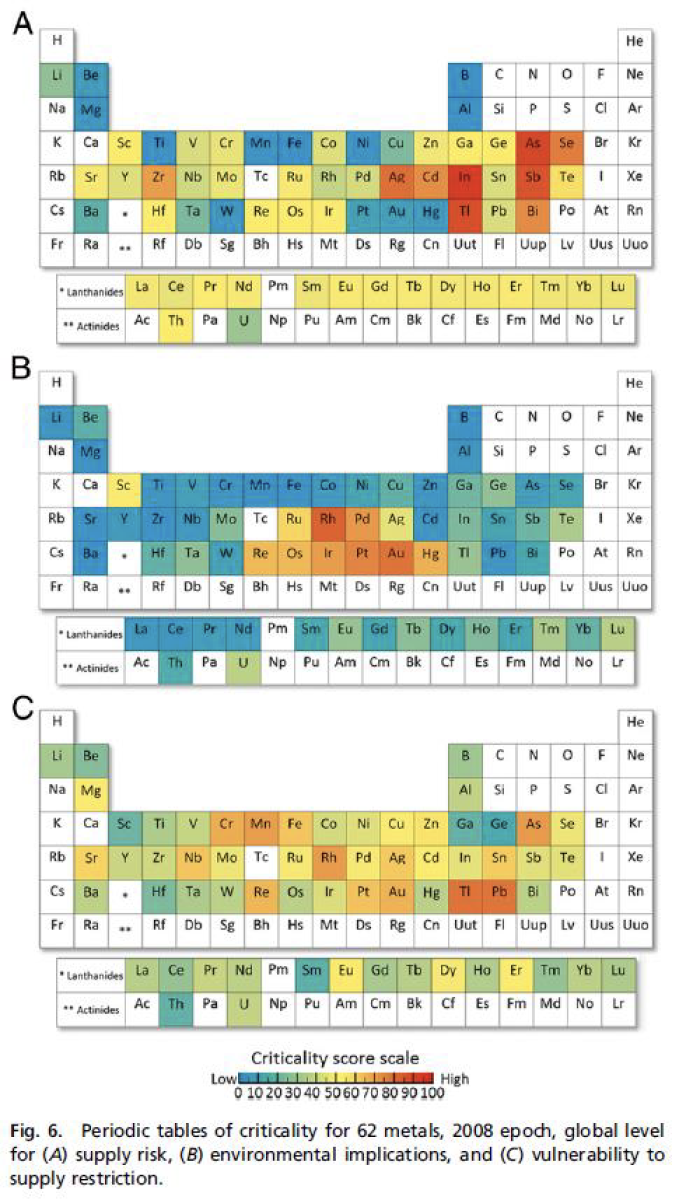
This methodology allow the comparison of varid elements for (here at global level) :
Supply risk
Environmental implications
Vulnerability to supply restriction
Keep in mind it is a relative assessment
Per kg comparison
Results may be underestimated
Database of 2008 (they were in the process ofupdating up to 2012 at publication in 2015)
As data revisions are not frequent & major technology changes occurs slowly, they recommand reassessment on a 5 years basis
Extracted from [23]
[25] HUISMAN, J., PAVEL, C., et al. 2020. Critical Raw Materials in Technologies and Sectors - Foresight [online].
Preserving stocks
Necessity & Limits of Recycling
[3] BIHOUIX, P., GUILLEBON, B. 2010. Quel futur pour les métaux?
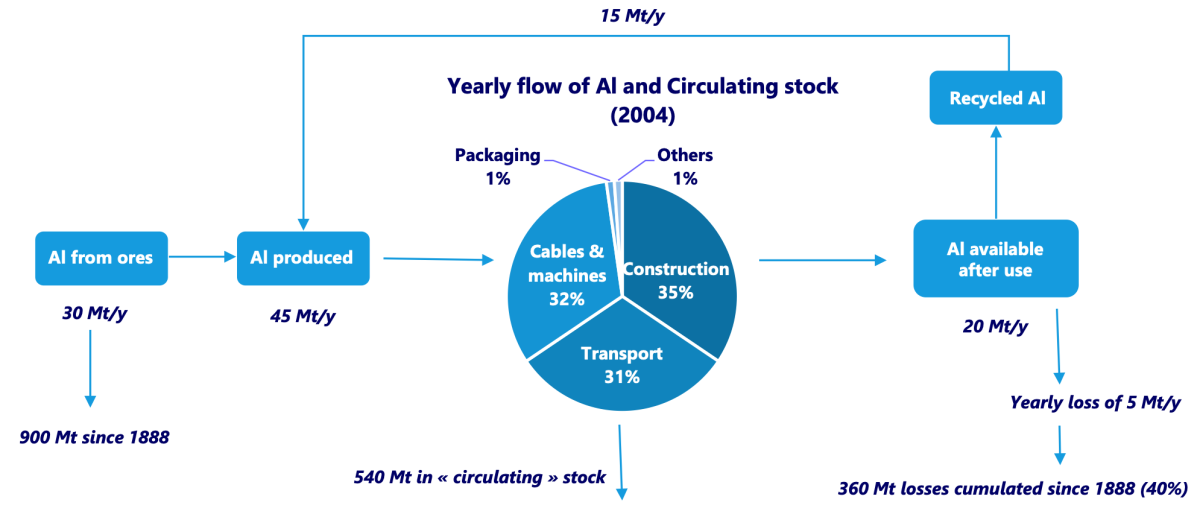
Major difference between oil (energy resources) and metals (mineral ressources) :
Oil, Coal & Natural Gas -> mostly burned -> The flow is not retrievable
Metals -> mostly materially conserved -> The flow is retrievable + there is a stock in circulation!
Each year, stocks of metals :
Increases of the producted quantity
Decreases of the lost quantity
Dispersive uses (metals used as dyes or fertilizers)
No recycling (incineration or landfill disposal)
Current recycling
Precious metals (Au) or with moderately high value (Cu): few losses
Less noble metals (Al, Zn) have more important loss rates
No data for a lot of metals used in specific applications (electronics...)
Metals are one of the most interesting category of materials for recycling
Theoretically recyclable an infinite amount of time without diminishing their properties
Have high yield for stock preservation
40% recycling rate -> 80% recycling rate <-> Reserves x 3
50% recycling rate -> 99,9% recycling rate <-> Reserves x 500
Rich countries show that recycling rate can reach high levels for base metals
France (2010): 85% for Fe ; 80% for Al & Cu ; 70% Pb ; 50% Zn [3]
But it cannot do everything
No industrial process have a 100% efficiency -> same for recycling (remelt Al generate a dispersed loss of 1-2%)
A lot of our uses are not compatible with recycling
The trend of higher complexity
> 30 metals in a computer
> 10 alloys of Steel in a car
Prevent us from retrieving the resources: not easy and sometimes techically impossible to detect or separate metals of an allow
This phenomena exist for a lot of our metarials
Glass: mix of transparent & colored glasses -> no more use in most of construction or cars, only bottles
Plastic: often reused in less demanding uses (technically or aestetically)
-> Important to rethink life-cycles of products, raw materials, and mostly uses
-> Integrate less performant or pretty materials & more recycled materials
-> Organize recovery channels to boost recycling rate
-> But also question the trend of high tech solutions instead of low tech ones
-> That is, question the needs
The trend of direct dispersive uses
Dyes (98% of Ti used as TiO2 for white dyes)
Fertilizers (P, Zn, etc.)
Additives (Cr in Glass)
Pesticides (CuSO4 in some organic farming plants)
And « indirecty » dispersive uses (very difficult to recover)
33% of Sn is used in welding
50% of Zn is used in galvanizing
Some metals like Co or Mb are nearly exclusively used in dispersive uses or alloys
The socioeconomic limits
Economical incentives to constructors are not present or sufficient
Lack of reglementation and means to enforce it
Complexity of products and recovery channels does not help
Substitution
Limit the use in rare or noble metals in favor of abondant metals
Critical lens on « innovation »
Aim to maximize a low tech approach as much as possible at the level of product and technology
-> For inorganic solar pannels, Si should be prefered to GaAs, CIGS, and others, even if the conversion efficiency is less important
For critical cases, possibilities needs to be carefully explored :
Cr nearly indispensible for anti-corrosion
-> Ti can replace Cr in certain cases but its energy footprint is 4-5 times higher
Cu nearly indispensible for electrical applications
-> Al can replace Cu in certain cases but its energy footprint is 2-3 times higher
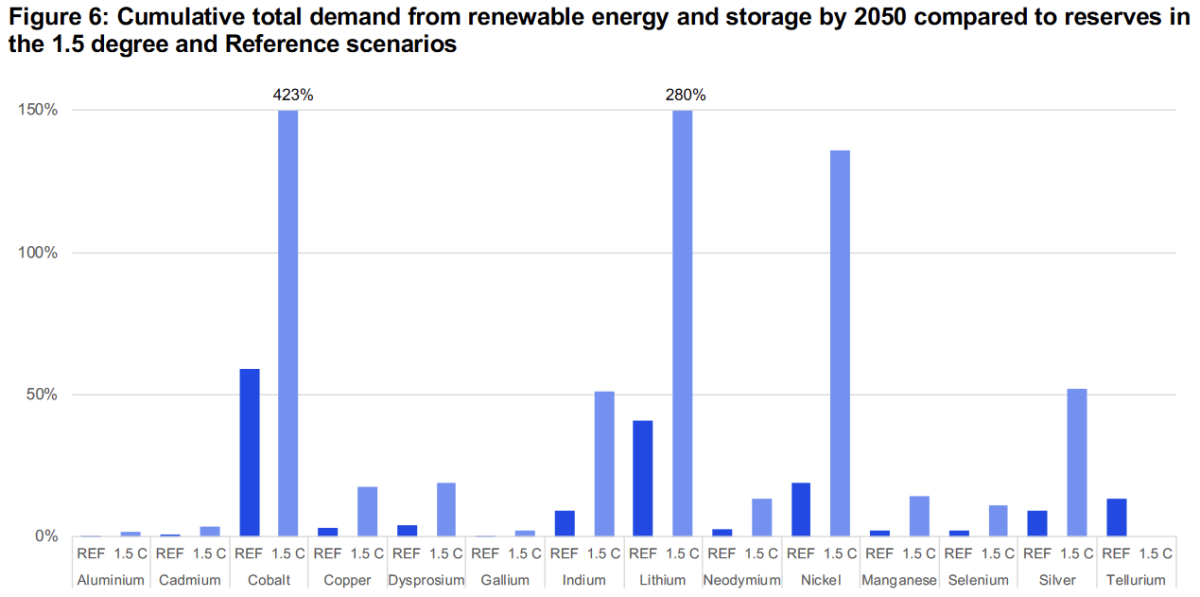
Substituate oil by electrification? [27]
Li-ion batteries represented 37% of Li consumption in 2016 (and 40% of Co)
Batteries for electric vehicules were only 10% of Li-ion consumption in 2018
Most elements at disposal indicates that strong choices of resources’s uses will have to be made in the years to come :
[27] Responsible minerals sourcing for renewable energy, 2019. University of Technology Sydney [online].
[28] ABDALLA, A. et al., 2018. Hydrogen production, storage, transportation and key challenges with applications: A review. DOI 10.1016/j.enconman.2018.03.088
[29] SCHMIDT, O., et al., 2017. Future cost and performance of water electrolysis: An expert elicitation study. DOI 10.1016/j.ijhydene.2017.10.045.
Substituate oil by « hydrogen »?
Currently > 90% of H2 is produced by steam reforming (10 kg CO2 per kg of H2 produced) [28]
Water electrolysis / fuel cells have problems of their own [29]
Alkaline electrolysis is not adapted for electric cars
New technologies currently depends either on Pt and are not industrially mature (PEM) or rare earths and are at the state of demonstrators (SO)
In need of a big & new infrastructure for supply of cars
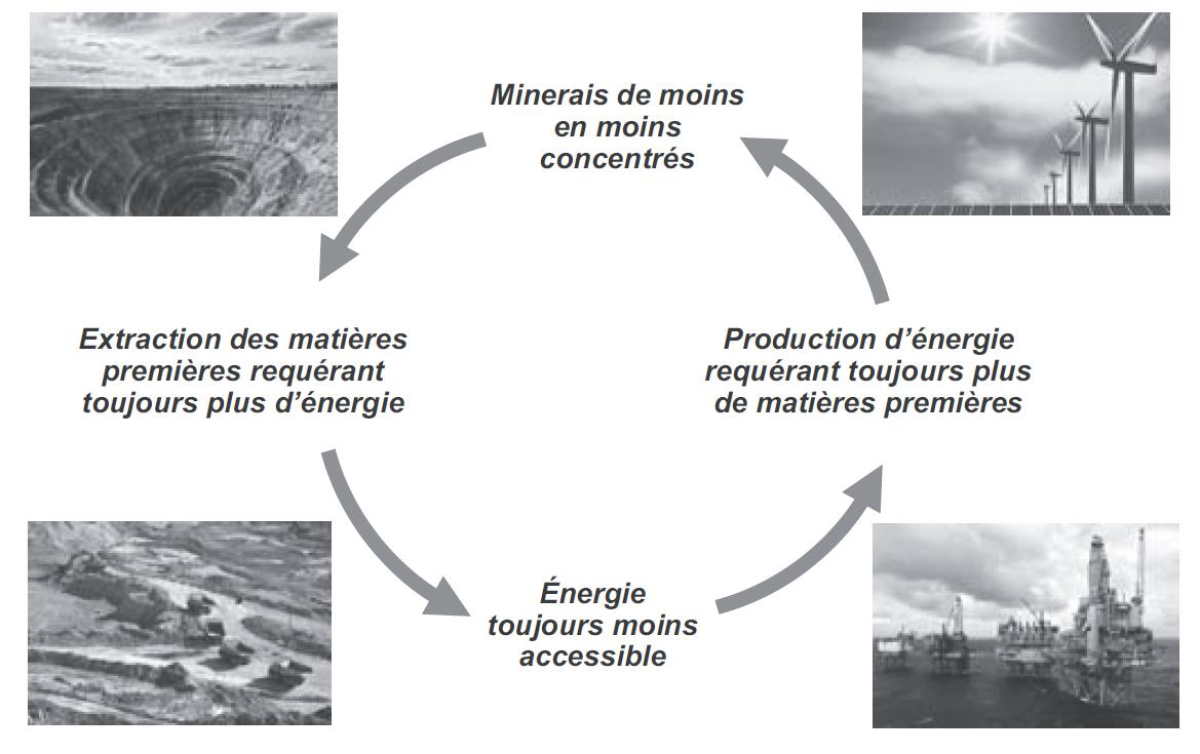
-> We are back to the vicious circle of energy & material footprint
Challenging needs
[30] BIHOUIX, Philippe, 2014. L’Age des low techs : vers une civilisation techniquement soutenable. Seuil.
The often most efficient stategy to preserve abiotic resources stock
House thermally isolated + put on a sweater >>> room heating technical solution
Most transport on bicycle (short distance) + train (long distance) with minimal use of a car (occasional rental) >>> electric cars replacing current diesel and petrol cars
Simple dismountable and repairable electronics >>> computer assembly with glue with digital prints technology
It is the first of the 7 principles of low-techs [30]
Challenging needs
Design and produce truly sustainable
Orienting knowledge to resources’ savings
Striking a technical balance between performance & conviviality
Relocalize without losing the right scale effects
De-machinizing services
Knowing to remain modest
Indeed this kind of transition imply numerous socioeconomical consequences
As any kind of transition, it is also a matter of flows and their evolution
Medias
A matter of Flow
The flows’s stakes
Climate change
[31] IPCC. 2014: mitigation of climate change: Working Group III contribution to the 5th Assessment Report of the IPCC.
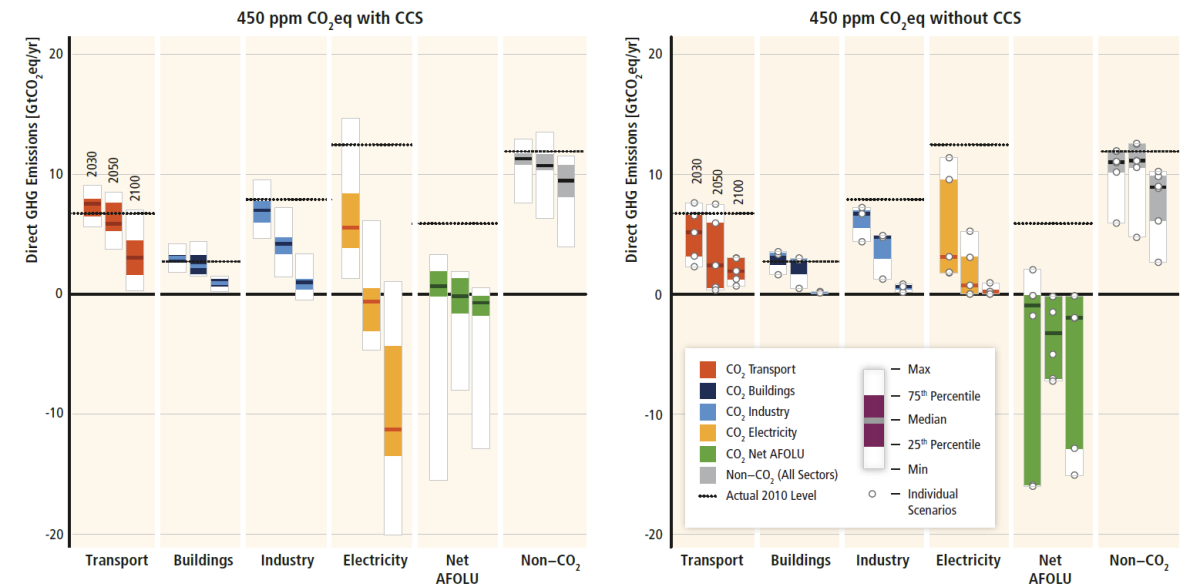
Trajectories mitigating climate change all require a global limitation of material & energy flows
Even with the hypothesis of a high developpment of the use of carbon capture and storage (CCS) technologies
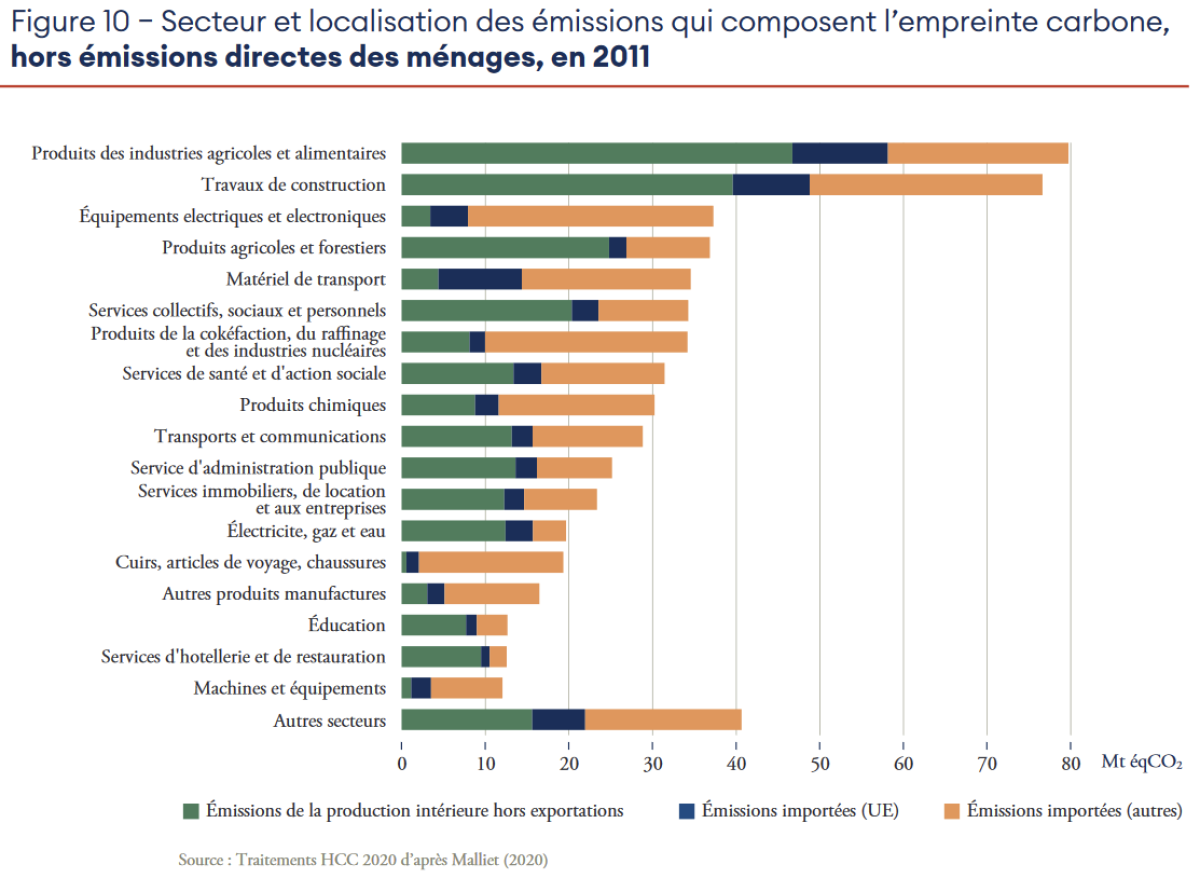
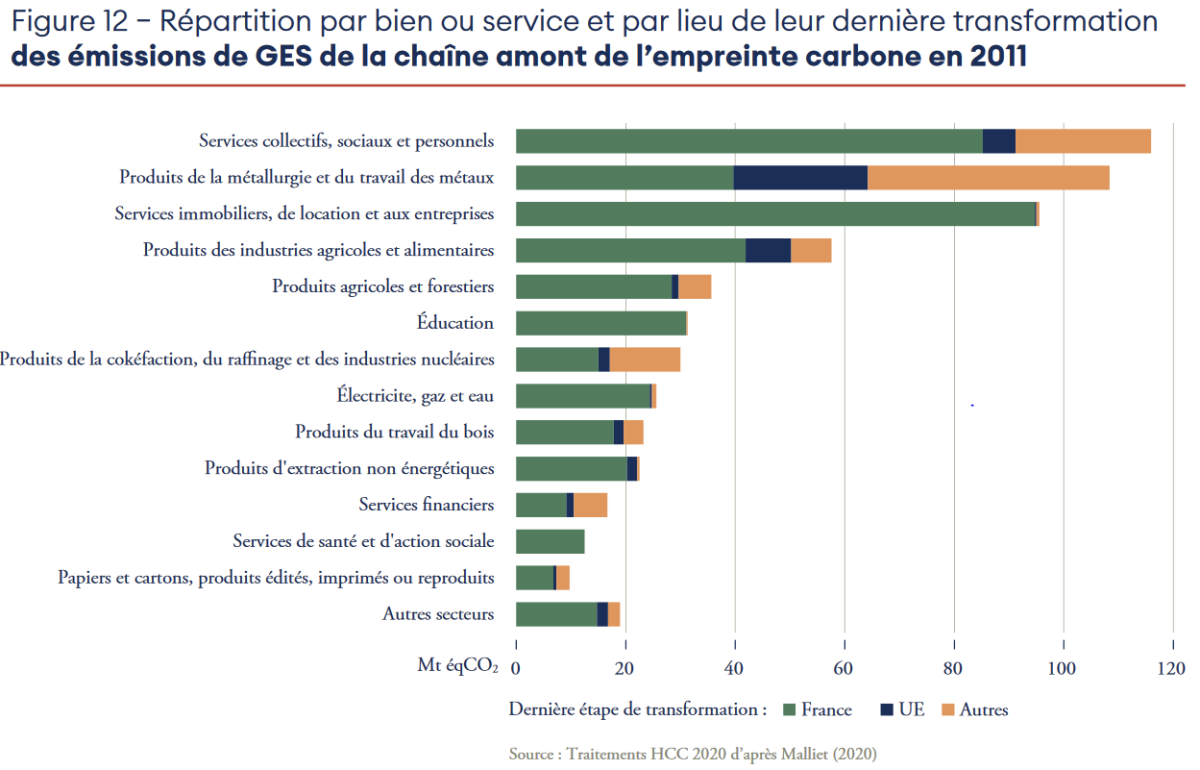
[32] HCC, 2020. Maîtriser l’empreinte carbone de la France. Haut Conseil pour le Climat [online].
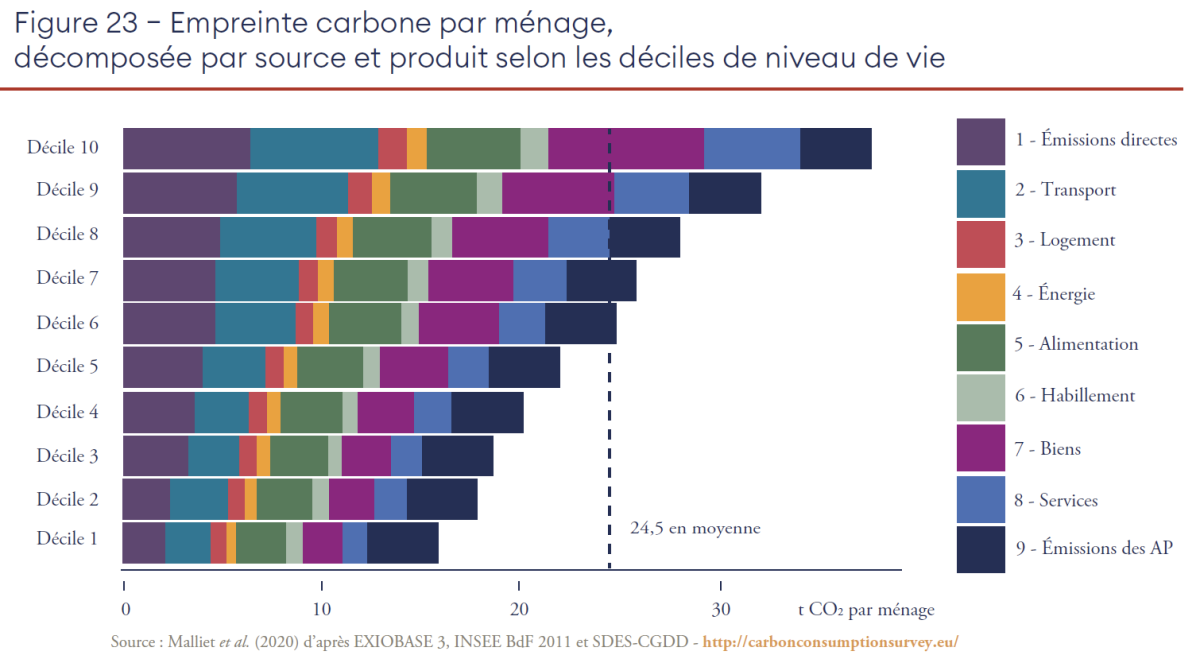
The French carbon footprint
A large part of our carbon footprint comes from importations
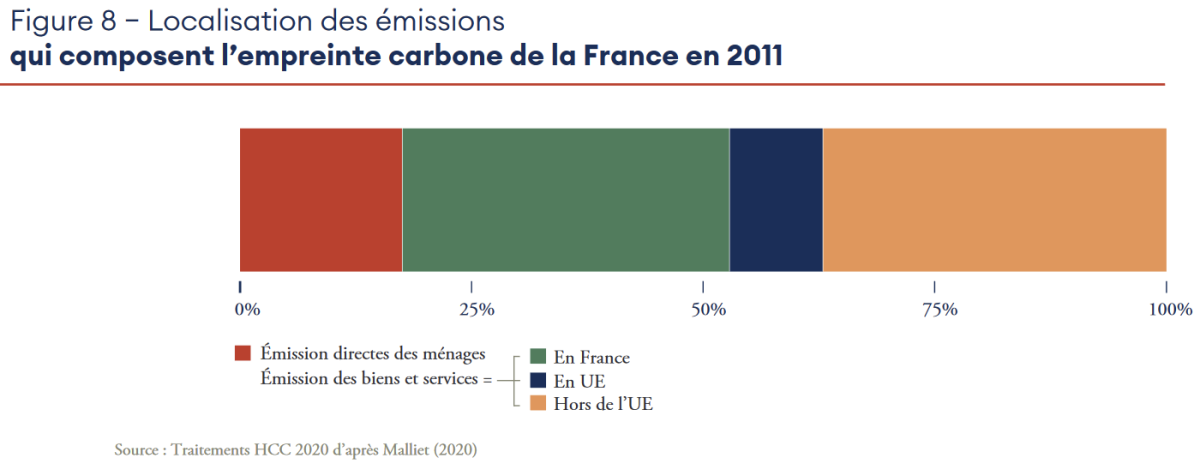
The French situation
Mineral resources: metals & cement
Energy resources & chemical products: oil
Abiotic resources are a large part of it, metals in particular!
In terms of weight of abiotic resources in domestic emissions: oil is dominant through transport (direct emissions), followed by metals & cement (indirect and distributed emissions)
High mitigation potential in transport <-> Combination of varied measures [31]
Low-carbon fuels -> higher flows of metals & lower flow of oil
Lowering vehicules energy intensities -> lower flows of oil & metals
Encouraging modal shift to lower-carbon passenger & freight systems
-> lower flows of oil + short-to-medium term higher flows of metals for infrastructure investments
Avoid journeys where possible -> lower flows of oils
This kind of configuration apply generally
Specific augmentations in flows of metal are required to lower oil flows
Competition between uses requiring metals -> priorities will need to be established
Economics interdependancies
[15] JANCOVICI, Jean-Marc, 2019. Les Energies fossiles. Ecole des Mines [online].
[34] HABERL, H., et al, 2020. A systematic review of the evidence on decoupling of GDP, resource use and GHG emissions, part II : synthesizing the insights. DOI 10.1088/1748-9326/ab842a.
[33] HCC, 2020. Rapport annuel - Redresser le cap, relancer la transition. Haut Conseil pour le Climat [online]. 2020.
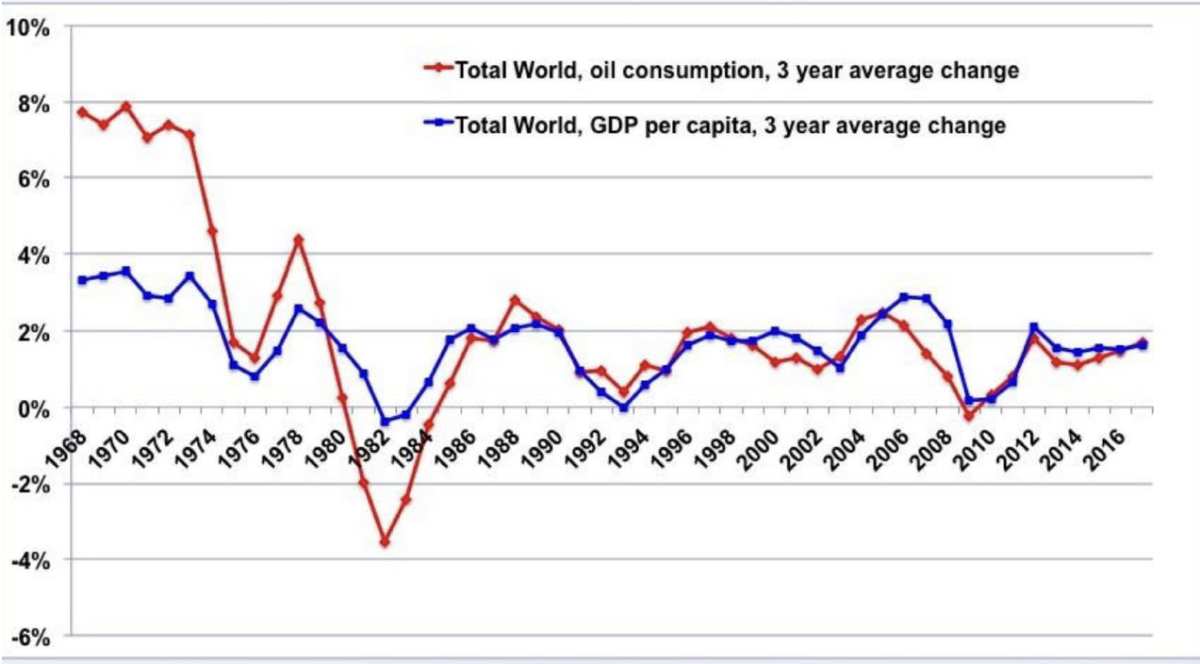
At world scale, there is a historical link between primary energy & material consumption, and economic production (as measured by GDP) [15] & [34]
There is no consensus on the exact nature of the relationship nowadays [33]
But we know that energy & material availability enables GDP growth
And GDP growth, by anticipation of economic growth causes energy & material use
A lot of ambitious climate target rely on the concept of « decoupling » [34]
Promotion of economic growth while reducing material & energy footprint (EMF)
When theorized as absolute -> EMF reduction & GDP growth
When theorized as relative -> EMF slow growth & GDP high growth
Recent systematic review clarifies that :
Relative decoupling is frequent for material use, GHG emissions, but not exergy
Relative decoupling of GDP and primary energy use can be caused by energy efficiency (higher ratio of exergy / primary energy use)
Absolute decoupling situations are very rare and are related to small short-term reductions of emissions
No evidence that absolute decoupling can be generalized
Degrowth/Sufficiency currently seems indispensible to meet climate target and sustainable use of abiotic resources:
Require a contraction of current economics functionning
And even fundamental changes in its functionning too
A byproduct of this scientific inquiries is that GDP is more & more considered as an irrelevant indicator for these problematics
Volatility of prices
[35] ECORYS, 2012. Mapping resource prices: the past & the future [online]. Final report to European Comission.
Base metals’ prices are historically quite constant relatively to each others but individual resource’s price is highly volatile [35]
[6] BP, 2020. BP Statistical Review of World Energy. [online].
Oil’s price is highly volatile too[6]
Resources’s prices underlying determinations
Percieved availability through control of producers
Degree of substitutability
Resources’s prices mecanisms of formations
Over-the-counter (OTC) markets: traditionnal mecanism
Annual or multi-year supply contracts: mainly, Fe and Fe allows
Pricing on forward markets
Special case of precious metals: considered as quasi-money or OTC.
Historically, numerous resources exchanges were operated by intermediates
Contemporary period: developpment of financialization
Alignment of Raw materials on securities -> far less intermediaries
Developpment of financial product derivatives + capitalistic concentrations of producers
-> overvalued prices and speculations
[36] MITTEAU, Gilles, 2018. Economie et finance du pétrole - Heu?reka. [online].
Financial markets’s specific effects
Efficiency of market -> Trends of prices themselves tend to diseapear
Short-term interest of traders -> Short-term volatility
Complexity of the product and implications of prices variations on the economy
-> Long-term volatility + impossibility to know for sure the causes of prices variations
-> There is no « natural price-signalling » mecanism that makes a non- renewable resource progressively more expensive overtime
-> The « natural » functionning of Financial markets seems to impply that the reduction of energy & material flows lead to higher volatility, or maybe higher « volatility of volatility »
For detailed reasonning, strong recommendation of Youtuber Heu?reka on Economy & Finance of oil
Contracting flows
Limits of efficiency
Like recycling, energy efficiency is necessary
Allow to reduce flows for a given performance
25% energy yield -> 30% energy yield -> 1/6 of oil flows spared per year
25% energy yield -> 50% energy yield -> 1/2 of oil flows spared per year
Same goes for « material efficiency » (diminshing the quantity of material needed to achieve a given functionnality)
But it is not sufficient, and could even be harmful on the global scale
Energy efficiency, when only measure applied, have mainly cost reduction effects
Cost reduction could then lead to democratize preexisting uses or create new ones
This then would lead to an overall increase in energy consumption
[37] SORRELL, Steve, 2007. The Rebound Effect: an assessment of the evidence for economy-wide energy savings from improved energy efficiency. [online]. UKERC
This would be called a « rebound effect » [37]
The « economy-wide » rebound effect is of combination of direct and indirect rebound effects that can interact with each other
Some basic examples of direct rebound effect :
If fuel-efficient vehicules make travel cheaper -> Consumers may choose to drive further / more often -> Offsets the energy savings
If a factory uses energy more efficiently -> Becomes more profitable -> May generate further investments -> More production
Some basic examples of indirect rebound effect :
Drivers of fuel-efficient cars may spend the money saved bying petrol on other energy intensive goods or services (ex: overseas flight)
[38] JEVONS, William Stanley, 1865. The Coal Question. . 1865. P. 213.
Rebound effect concept coms back to the XIXth century
Firstly known as « Jevons paradox » from W. J. Jevons [38]
Steam-engines’ efficiency had been increased by 10-fold at least in a century
Consumption of coal had greatly increased anyway (x 6 in 50 years)
The same considerations could be made about today :
Energy efficiency of cars’ engines have never been better
Our oil cosumption dedicated to it have never been higher
-> Could be explained by:
The growth of car use driven by low cost of oil
And spared cost of cars invested in high-tech supplementary functions which increase car’s weight and maintain oil consumption
The increase in heavy vehicules like SUVs
[39] STERN, David I., 2017. How accurate are energy intensity projections?. DOI 10.1007/s10584-017-2003-3.
Quantified contemporary estimations are complicated :
There is indeed a correlation between various measures of energy efficiency and continuing growth of overall energy consumption
But the causal links between these trends are not clear
Difficulty to assess other things than direct rebound effects
That being said, evidence suggest that : [37]
It has the potential to widely vary between technologies, sectors, income groups
In OECD countries, automotive transport, household heating & cooling can relatively robustly be considered subjects to a direct rebound effect of 10-30% (microscale)
Current energy or material efficiency policies are not up to the task (macroscale)
Predictions of energy footprint decline itself are generally too optimistic [39]
Physics inevitability
[40] HALL, Charles A. S., et al., 2014. EROI of different fuels and the implications for society. DOI 10.1016/j.enpol.2013.05.049.
Material & Energy flows will decline anyway due to the physics underlying the production peak
We’ve seen that the decline in ores’s grade do lead to an exponential demand in energy for base metals extraction, and that a mineralogical barrier can happen for rarer metals
But oil itself needs energy to be extracted!
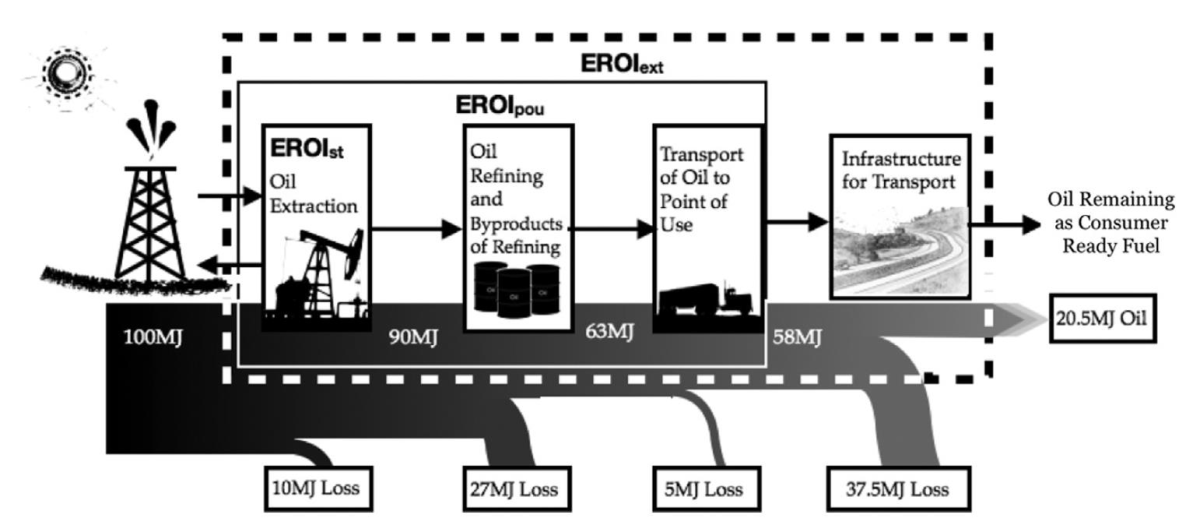
Last notion of this course : EROI – Energy return on investment
Ratio of energy delivered by a specific energy vector and the energy invested in the capture & delivery of this energy
Measures the relative quality of energy vectors
Varied possible choices of boundaries in systemic assessments, so as much EROI calculations: standard ; point of use ; extended ; societal
Estimates re complicated due to oil compagnies low level of transparency
As oil is often extracted together with natural gas, calculations can be tricky
But all estimates tend to show a progressive decrease in EROI for every place where data is available : here in USA
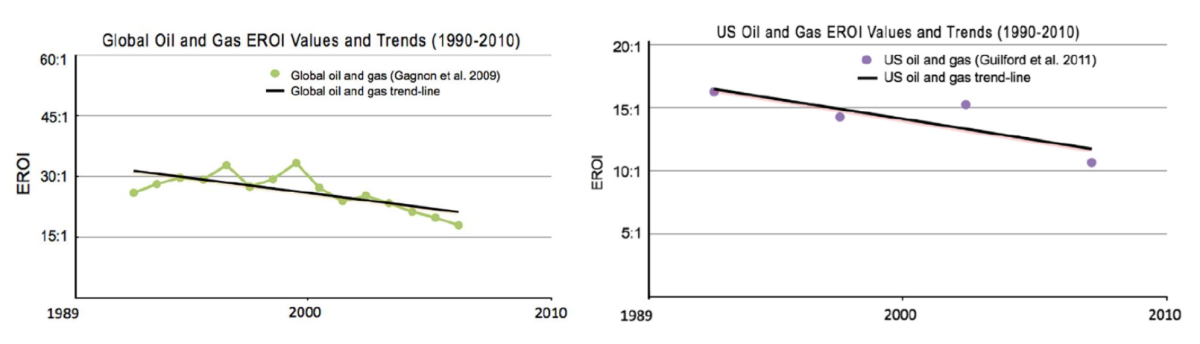
Is there a trend for oil already?
It seems so
All estimates tend to show a progressive decrease in EROI for every place where data is available : here in USA
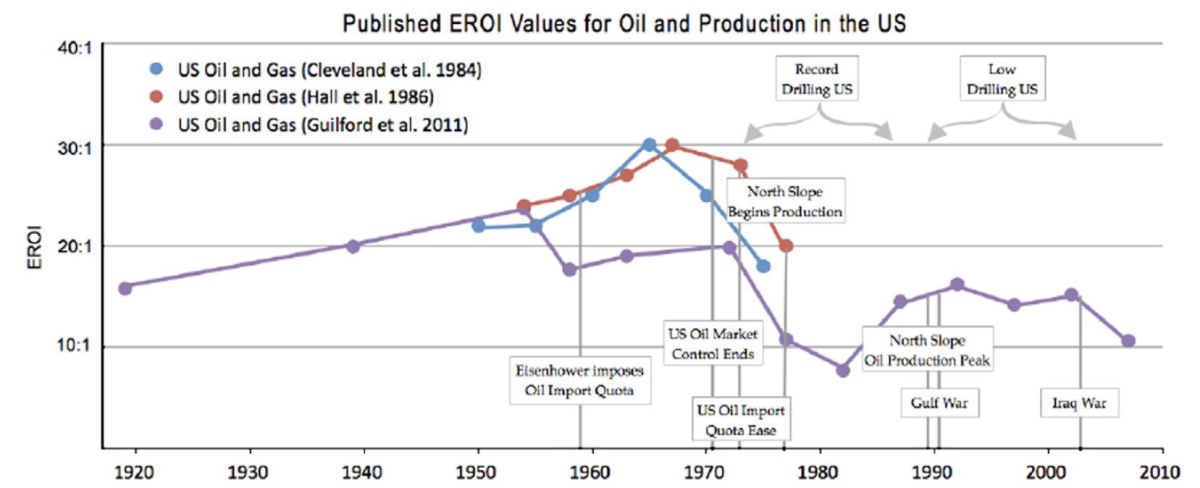
Is there a trend for oil already?
Pretty much so!
All estimates tend to show a progressive decrease in EROI for every place where data is available : here in Canada
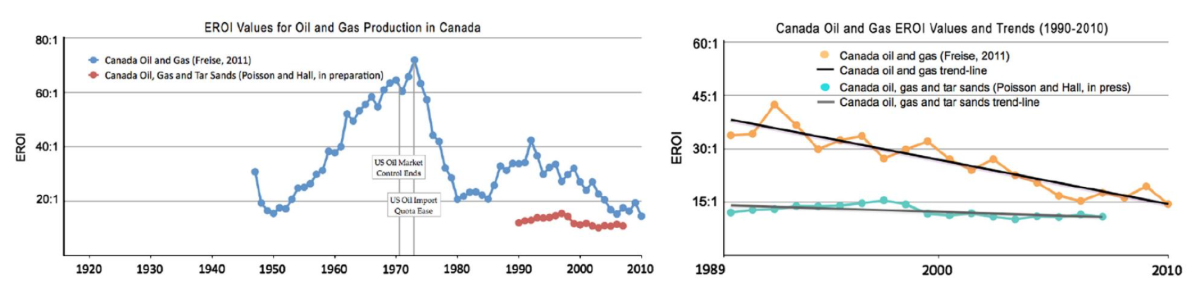
Is there a trend for oil already?
Undeniably so!
All estimates tend to show a progressive decrease in EROI for every place where data is available : here in various other countries
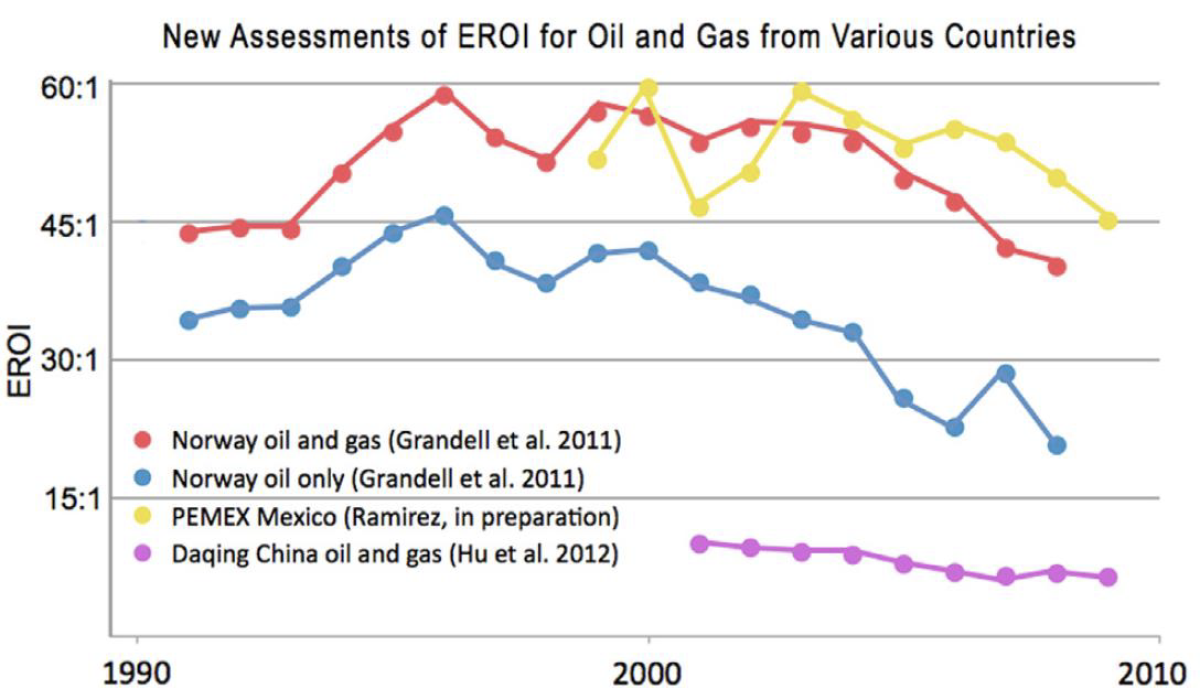
It is logical from what we’ve seen about the concentration of resources in general. But why does it especially matter here?
The decrease of the EROI of conventionnal oil means we’ll need to set aside a growing share of the oil flows just to continue to have a flow
This share of oil « lost » will no longer be used to supply other sectors [36]
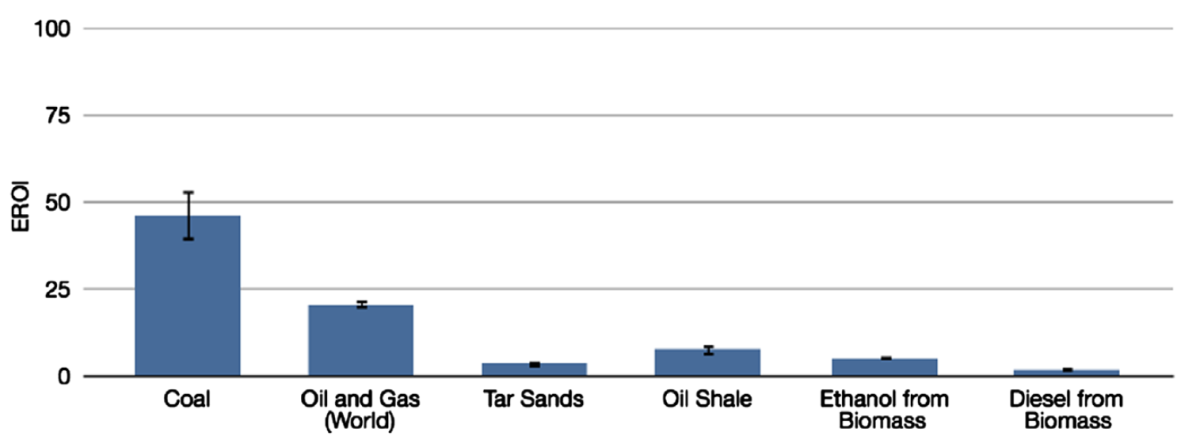
Non conventionnal oils have a base EROI quite lower than conventionnal (and will also decrease with their further exploitation) [40]
Managing consequences, tackling causes
[36] MITTEAU, Gilles, 2018. Economie et finance du pétrole -Heu?reka. [online].
[40] HALL, Charles A. S., et al., 2014. EROI of different fuels and the implications for society. DOI 10.1016/j.enpol.2013.05.049.
[33] HCC, 2020. Rapport annuel -Redresser le cap, relancer la transition. Haut Conseil pour le Climat [online]. 2020.
As there is no absolute decoupling, a contraction & instability of economy and as we know it seems unavoidable in the medium-term, regardless of climate change [36] & [40]
By « economy », here, we mean that all socioeconomical & geopolitical relationships will be impacted
Social acceptability of dynamics created by contracting flows will be a key component of the success ofmitigating policies [33]
-> Ecological transition is also a social one
This is were we, as engineers & citizens, have apart to play
We would gain a lot to take inspiration from the 7 principles of low-techs [30]
Challenging needs
Design and produce truly sustainable
Orienting knowledge to resources’ savings
Striking a technical balance between performance & conviviality
Relocalize without losing the right scale effects
De-machinizing services
Knowing to remain modest
[30] BIHOUIX, Philippe, 2014. L’Age des low techs : vers une civilisation techniquement soutenable. Seuil.
Medias
Bibliography
[1] BEYLOT, Antoine, ARDENTE, Fulvio, SALA, Serenella and ZAMPORI, Luca, 2020. Accounting for the dissipation of abiotic resources in LCA: Status, key challenges and potential way forward. Resources, Conservation and Recycling. 1 June 2020. Vol. 157, p. 104748. DOI 10.1016/j.resconrec.2020.104748.
[2] Resource, 2020. Wikipedia [online]. Available from: https://en.wikipedia.org/w/index.php?title=Resource&oldid=982763984
[3] BIHOUIX, Philippe, GUILLEBON, Benoît de and CENTRE NATIONAL DU LIVRE (FRANCE), 2010. Quel futur pour les métaux? raréfaction des métaux: un nouveau défi pour la société. Les Ulis, France: EDP sciences. ISBN 978-2-7598-0713-0.
[4] History of the oil shale industry, 2020. Wikipedia [online]. Available from: https://en.wikipedia.org/w/index.php?title=History_of_the_oil_shale_industry&oldid=966512236
[5] ALIX, Pierre, BURNHAM, Alan, FOWLER, Tom, KLEINBERG, Michael and SYMINGTON, Bill, 2010. Coaxing Oil from Shale. Oilfield Review [online]. 2011 2010. Vol. 22, no. 4. Available from: https://web.archive.org/web/20150106093639/http://www.slb.com/~/media/Files/resources/oilfield_review/ors10/win10/coaxing.ashx
[6] BP, 2020. BP Statistical Review of World Energy. [online]. 2020. No. 69. Available from: https://www.bp.com/content/dam/bp/business-sites/en/global/corporate/pdfs/energy-economics/statistical-review/bp-stats-review-2020-full-report.pdf
[8] Petroleum, 2020. Wikipedia [online]. Available from: https://en.wikipedia.org/w/index.php?title=Petroleum&oldid=985135121
[9] BONNEUIL, Christophe and FRESSOZ, Jean-Baptiste, 2016. L’événement anthropocène: la Terre, l’histoire et nous. Nouvelle éd. révisée et augmentée. Paris: Éditions Points. ISBN 978-2-7578-5959-9.
[10] Data & Statistics. IEA [online]. Available from: https://www.iea.org/data-and-statistics
[11] USGS, 2014. Estimate of Undiscovered Copper Resources of the World [online]. Fact Sheet. Fact Sheet. Available from: https://pubs.usgs.gov/fs/2014/3004/pdf/fs2014-3004.pdf
[12] USGS, 2020. Mineral Commodity Summaries [online]. Available from: https://pubs.usgs.gov/periodicals/mcs2020/mcs2020.pdf
[13] SKINNER, B.J., 1979. Chapter 10 A Second Iron Age Ahead? In: Studies in Environmental Science [online]. Elsevier. p. 559–575. ISBN 978-0-444-41745-9. Available from: https://linkinghub.elsevier.com/retrieve/pii/S0166111608710719
[14] AYRES, Robert U, 2001. Resources, Scarcity, Growth and the Environment. . 2001. P. 35.
[15] JANCOVICI, Jean-Marc, 2019. Les Energies fossiles. Ecole des Mines [online]. 2019. Available from: https://drive.google.com/drive/folders/1fqoACrCFtlXKonP266DkFUcmMVj22yj_
[16] ELAW, Environmental Law Alliance Worldwilde, 2010. 1st Edition: Guide pour l’évaluation de EIE de projets miniers [online]. Available from: https://www.elaw.org/files/mining-eia-guidebook/Chapitre%201.pdf
[17] Hydraulic Fracturing 101, [no date]. Earthworks [online]. Available from: https://www.earthworks.org/issues/hydraulic_fracturing_101/
[18] RITCHIE, Hannah and ROSER, Max, 2017. CO₂ and Greenhouse Gas Emissions. Our World in Data [online]. 11 May 2017. Available from: https://ourworldindata.org/co2-and-other-greenhouse-gas-emissions
[19] BONNEUIL, Christophe and FRESSOZ, Jean-Baptiste, 2016. L’événement anthropocène: la Terre, l’histoire et nous. Nouvelle éd. révisée et augmentée. Paris: Éditions Points. ISBN 978-2-7578-5959-9. [Same that [9], little mistake on my part here)
[20] EIA, U.S. Energy Information Administration, 2016. Carbon Dioxide Emissions Coefficients. [online]. 2016. Available from: https://www.eia.gov/environment/emissions/co2_vol_mass.php
[21] ROGELJ, Joeri, SHINDELL, Drew, JIANG, Kejun, FIFITA, Solomone, FORSTER, Piers, GINZBURG, Veronika, HANDA, Collins, KOBAYASHI, Shigeki, KRIEGLER, Elmar, MUNDACA, Luis, SÉFÉRIAN, Roland, VILARIÑO, Maria Virginia, CALVIN, Katherine, EMMERLING, Johannes, FUSS, Sabine, GILLETT, Nathan, HE, Chenmin, HERTWICH, Edgar, HÖGLUND-ISAKSSON, Lena, HUPPMANN, Daniel, LUDERER, Gunnar, MCCOLLUM, David L, MEINSHAUSEN, Malte, MILLAR, Richard, POPP, Alexander, PUROHIT, Pallav, RIAHI, Keywan, RIBES, Aurélien, SAUNDERS, Harry, SCHÄDEL, Christina, SMITH, Pete, TRUTNEVYTE, Evelina, XIU, Yang, ZHOU, Wenji, ZICKFELD, Kirsten, FLATO, Greg, FUGLESTVEDT, Jan, MRABET, Rachid and SCHAEFFER, Roberto, 2018. Mitigation Pathways Compatible with 1.5°C in the Context of Sustainable Development. In: Global Warming of 1.5°C. An IPCC Special Report on the impacts of global warming of 1.5°C above pre-industrial levels and related global greenhouse gas emission pathways, in the context of strengthening the global response to the threat of climate change, sustainable development, and efforts to eradicate poverty [Masson-Delmotte, V., P. Zhai, H.-O. Pörtner, D. Roberts, J. Skea, P.R. Shukla, A. Pirani, W. Moufouma-Okia, C. Péan, R. Pidcock, S. Connors, J.B.R. Matthews, Y. Chen, X. Zhou, M.I. Gomis, E. Lonnoy, T. Maycock, M. Tignor, and T. Waterfield (eds.)]. In Press.
[22] World Energy Outlook 2018 - Analysis and key findings. A report by the International Energy Agency.
[23] CALVO, Guiomar, VALERO, Alicia and VALERO, Antonio, 2017. Assessing maximum production peak and resource availability of non-fuel mineral resources: Analyzing the influence of extractable global resources. Resources, Conservation and Recycling. 1 October 2017. Vol. 125, p. 208–217. DOI 10.1016/j.resconrec.2017.06.009.
[24] PRIOR, T., GIURCO, D., MUDD, G., MASON, L. and BEHRISCH, J., 2012. Resource depletion, peak minerals and the implications for sustainable resource management. Global Environmental Change. 1 August 2012. Vol. 22, no. 3, p. 577–587. DOI 10.1016/j.gloenvcha.2011.08.009.
[25] HUISMAN, J. and PAVEL, C., 2020. Critical Raw Materials in Technologies and Sectors - Foresight [online]. European Commission - Joint Research Centre. Available from: https://ec.europa.eu/docsroom/documents/42881
[26] GRAEDEL, T. E., HARPER, E. M., NASSAR, N. T., NUSS, Philip and RECK, Barbara K., 2015a. Criticality of metals and metalloids. Proceedings of the National Academy of Sciences. 7 April 2015. Vol. 112, no. 14, p. 4257–4262. DOI 10.1073/pnas.1500415112.
[27] Responsible minerals sourcing for renewable energy, 2019. University of Technology Sydney [online]. Available from: https://www.uts.edu.au/research-and-teaching/our-research/institute-sustainable-futures/our-research/resource-futures/responsible-minerals-for-renewable-energy
[28] ABDALLA, Abdalla M., HOSSAIN, Shahzad, NISFINDY, Ozzan B., AZAD, Atia T., DAWOOD, Mohamed and AZAD, Abul K., 2018. Hydrogen production, storage, transportation and key challenges with applications: A review. Energy Conversion and Management. 1 June 2018. Vol. 165, p. 602–627. DOI 10.1016/j.enconman.2018.03.088.
[29] SCHMIDT, O., GAMBHIR, A., STAFFELL, I., HAWKES, A., NELSON, J. and FEW, S., 2017. Future cost and performance of water electrolysis: An expert elicitation study. International Journal of Hydrogen Energy. 28 December 2017. Vol. 42, no. 52, p. 30470–30492. DOI 10.1016/j.ijhydene.2017.10.045.
[30] BIHOUIX, Philippe, 2014. L’Age des low techs : vers une civilisation techniquement soutenable. Seuil.
[31] INTERGOVERNMENTAL PANEL ON CLIMATE CHANGE and EDENHOFER, Ottmar (eds.), 2014. Climate change 2014: mitigation of climate change: Working Group III contribution to the Fifth Assessment Report of the Intergovernmental Panel on Climate Change. New York, NY: Cambridge University Press. ISBN 978-1-107-05821-7. QC903 .I492 2014
[32] HCC, 2020b. Maîtriser l’empreinte carbone de la France [online]. Available from: https://www.hautconseilclimat.fr/actualites/le-hcc-presente-son-rapport-maitriser-lempreinte-carbone-de-la-france/
[33] HCC, 2020a. Rapport annuel - Redresser le cap, relancer la transition [online]. Available from: https://www.hautconseilclimat.fr/publications/rapport-annuel-2020/
[34] HABERL, Helmut, WIEDENHOFER, Dominik, VIRÁG, Doris, KALT, Gerald, PLANK, Barbara, BROCKWAY, Paul, FISHMAN, Tomer, HAUSKNOST, Daniel, KRAUSMANN, Fridolin, LEON-GRUCHALSKI, Bartholomäus, MAYER, Andreas, PICHLER, Melanie, SCHAFFARTZIK, Anke, SOUSA, Tânia, STREECK, Jan and CREUTZIG, Felix, 2020. A systematic review of the evidence on decoupling of GDP, resource use and GHG emissions, part II: synthesizing the insights. Environmental Research Letters. June 2020. Vol. 15, no. 6, p. 065003. DOI 10.1088/1748-9326/ab842a.
[35] ECORYS, 2012. Mapping resource prices: the past & the future [online]. Final report to European Comission. Available from: https://ec.europa.eu/environment/enveco/resource_efficiency/pdf/studies/report_mapping_resource_prices.pdf
[36] MITTEAU, Gilles, 2018a. Economie et finance du pétrole - Heu?reka. [online]. 2018. Available from: https://www.youtube.com/playlist?list=PLbHgDl1izvbnWaSCpgo6m4Z1EGBT6QBJ5
[37] SORRELL, Steve, 2007. The Rebound Effect: an assessment of the evidence for economy-wide energy savings from improved energy efficiency. [online]. UKERC. Available from: https://businessdocbox.com/Green_Solutions/70206684-The-rebound-effect-an-assessment-of-the-evidence-for-economy-wide-energy-savings-from-improved-energy-efficiency-october-2007.html
[38] JEVONS, William Stanley, 1865. The Coal Question. 1865. P. 213.
[39] STERN, David I., 2017. How accurate are energy intensity projections? Climatic Change. 1 August 2017. Vol. 143, no. 3, p. 537–545. DOI 10.1007/s10584-017-2003-3.
[40] HALL, Charles A. S., LAMBERT, Jessica G. and BALOGH, Stephen B., 2014. EROI of different fuels and the implications for society. Energy Policy. 1 January 2014. Vol. 64, p. 141–152. DOI 10.1016/j.enpol.2013.05.049.
Supplmentary bibliographical references that might interest you:
CALAS, Georges, 2014. Les ressources minérales, un enjeu majeur dans le contexte du développement durable. [online]. 2015 2014. Available from: https://www.college-de-france.fr/site/georges-calas/course-2014-2015.htm
Energy Policies of IEA Countries: United States 2019 Review. IEA Webstore [online]. Available from: https://webstore.iea.org/energy-policies-of-iea-countries-united-states-2019-review
HABIB, Komal, HAMELIN, Lorie and WENZEL, Henrik, 2016. A dynamic perspective of the geopolitical supply risk of metals. Journal of Cleaner Production. 1 October 2016. Vol. 133, p. 850–858. DOI 10.1016/j.jclepro.2016.05.118.
HABIB, Komal, SCHMIDT, Jannick H. and CHRISTENSEN, Per, 2013. A historical perspective of Global Warming Potential from Municipal Solid Waste Management. Waste Management. 1 September 2013. Vol. 33, no. 9, p. 1926–1933. DOI 10.1016/j.wasman.2013.04.016.
HABIB, Komal and WENZEL, Henrik, 2014. Exploring rare earths supply constraints for the emerging clean energy technologies and the role of recycling. Journal of Cleaner Production. 1 December 2014. Vol. 84, p. 348–359. DOI 10.1016/j.jclepro.2014.04.035.
IEA, 2021. The Role of Critical Minerals in Clean Energy Transitions [online]. IEA. Available from: https://www.iea.org/reports/the-role-of-critical-minerals-in-clean-energy-transitions
MEYER, R. La Capture et Séquestration de Carbone pour réduire nos émissions de CO2 - CARBONE#4, 2020. [online]. Available from: https://www.youtube.com/watch?v=AQlqQEhVi1M
PARRIQUE, Timothée, 2019. The political economy of degrowth [online]. phdthesis. Stockholms universitet. Available from: https://tel.archives-ouvertes.fr/tel-02499463
RECK, B. K. and GRAEDEL, T. E., 2012. Challenges in Metal Recycling. Science. 10 August 2012. Vol. 337, no. 6095, p. 690–695. DOI 10.1126/science.1217501.
SCHAFFARTZIK, Anke, MAYER, Andreas, GINGRICH, Simone, EISENMENGER, Nina, LOY, Christian and KRAUSMANN, Fridolin, 2014. The global metabolic transition: Regional patterns and trends of global material flows, 1950–2010. Global Environmental Change. May 2014. Vol. 26, p. 87–97. DOI 10.1016/j.gloenvcha.2014.03.013.
SCHRIJVERS, Dieuwertje, HOOL, Alessandra, BLENGINI, Gian Andrea, CHEN, Wei-Qiang, DEWULF, Jo, EGGERT, Roderick, VAN ELLEN, Layla, GAUSS, Roland, GODDIN, James, HABIB, Komal, HAGELÜKEN, Christian, HIROHATA, Atsufumi, HOFMANN-AMTENBRINK, Margarethe, KOSMOL, Jan, LE GLEUHER, Maïté, GROHOL, Milan, KU, Anthony, LEE, Min-Ha, LIU, Gang, NANSAI, Keisuke, NUSS, Philip, PECK, David, RELLER, Armin, SONNEMANN, Guido, TERCERO, Luis, THORENZ, Andrea and WÄGER, Patrick A., 2020. A review of methods and data to determine raw material criticality. Resources, Conservation and Recycling. 1 April 2020. Vol. 155, p. 104617. DOI 10.1016/j.resconrec.2019.104617.
STERN, David I., 2020. How large is the economy-wide rebound effect? Energy Policy. 1 December 2020. Vol. 147, p. 111870. DOI 10.1016/j.enpol.2020.111870.
UNEP (ed.), 2013. Metal recycling: opportunities, limits, infrastructure: this is report 2b of the Global Metal Flows Working Group of the International Resource Panel of UNEP. Nairobi, Kenya: United Nations Environment Programme. ISBN 978-92-807-3267-2.